Since e-j(2πk) is always equal to 1 whatever the value of k. Hence, we have
|
(14.20) |
The coefficients Xn therefore just repeat themselves for n > (N-1), so that if we plot the magnitudes ![]() along a frequency axis ωn = 2πn/NΔt, the graph repeats itself periodically. Furthermore, it is also easy to see that from equation that, provided terms in the {xk} series are real, we have
along a frequency axis ωn = 2πn/NΔt, the graph repeats itself periodically. Furthermore, it is also easy to see that from equation that, provided terms in the {xk} series are real, we have
|
(14.21) |
where X1* is the complex conjugate of X1. Hence
|
(14.22) |
so the spectra diagram for the ![]() would be symmetrical about the zero frequency position. The unique part of the graph occupies the frequency range
would be symmetrical about the zero frequency position. The unique part of the graph occupies the frequency range ![]() . Higher frequencies just show spurious Fourier coefficients which are repetitions of those apply at frequencies below π/Δt. We can therefore see that the coefficients Xn calculated by the DFT are only correct Fourier coefficients for frequencies up to
. Higher frequencies just show spurious Fourier coefficients which are repetitions of those apply at frequencies below π/Δt. We can therefore see that the coefficients Xn calculated by the DFT are only correct Fourier coefficients for frequencies up to
|
(14.23) |
that is for n in the range n = 0,1,2,...,N/2. Moreover, if there are frequencies above π/Δt present in the original signal, these introduce a distortion of the graph called aliasing. The high frequency components contribute to the {xk} series and falsely distort the Fourier coefficients calculated by the DFT for frequencies below π/Δt. If ωmax is the maximum frequency component present in x(t), then aliasing can be avoided by ensuring that the sampling interval Δt is small enough that
|
(14.24) |
with
|
(14.25) |
The frequency 1/2Δ is called the Nyquist frequency (or sometimes the folding frequency) and is the maximum frequency that can be detected from data sampled at time spacing Δ. The phenomenon of aliasing is most important when analyzing practical data. The sampling frequency 1/2Δ must be high enough to cover the full frequency range of the continuous time series. Otherwise the spectrum from equally spaced sampled will differ from the true spectrum because of aliasing. In some cases the only way to be certain that this condition is met may be to filter the time series to remove intentionally all frequency components higher than 1/2Δ before beginning the analysis.
Example 14.5 A square wave with period T = 8 sec and sixteen sampled data: x0 =.....= x4 = 1 and x5 =.....= x15 = 0. (i) Obtain the spectrum of the discrete time series. (ii) Compare the spectrum of the same square wave for thirty two sampled data: x0 =.....= x8 = 1 and x9 =.....= x31 = 0. It should be noted that the signal is sampled intentionally in the range that coincides with the period of the original square wave to avoid the leakage error.
Solution: (i) Sixteen sampled points: The sampling of the square wave for sixteen sampled data is shown in Figure 14.25. The period of the signal is 8 sec, hence the fundamental frequency would be f0 = 1/T = 1/8 = 0.125 Hz. The sampling interval is Δt = T/N = 8/16 = 0.5 sec. The Nyquist frequency would be fc = 1/2ΔT = 1/(2 X 0.5) = 1 Hz. Hence, the maximum harmonics which will be valid is n = fc/f0 = 1/0.125 = 8. Total number of harmonics are same as number of sampled points, i.e., 16.
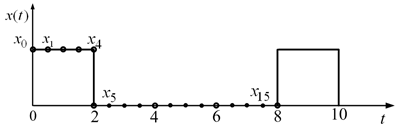
Figure 14.25 Discrete time series of a square wave
On using equation (14.14), the spectrum, Xn, can be calculated by simple substitution and addition of various terms. For the present case N = 16. In general, Xn is a complex quantity and it can be plotted in various form, e.g., (a) the real An = Re(Xn) and imaginary Bn = Im(Xn) parts versus harmonic number, n, (or frequency, f), (Figure 14.26(a, b)) and (b) the magnitude ![]() and phase
and phase ![]() versus harmonic number, n, (or frequency, f) (Figure 14.26(c, d)).
versus harmonic number, n, (or frequency, f) (Figure 14.26(c, d)).
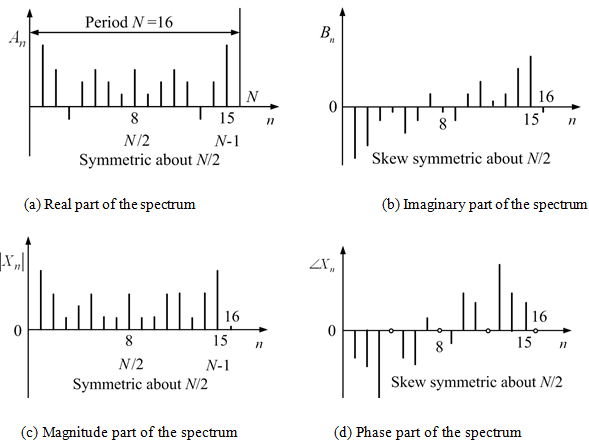
Figure 14.26 Spectrum of the discrete time series for a square wave with sixteen sampled points
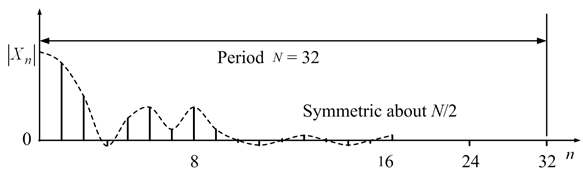
Figure 14.27 Spectrum of the discrete time series for a square wave with thirty-two sampled points
These spectra have the following characteristics: (a) The spectra is periodic with period N (this is also observed in equation (14.20)). (b) The same spectra as those of the negative order n = -N/2, …, -1 also appear in the range n = N/2, …, (N-1). (c) The spectra of the real part and those of the amplitude are both symmetric about n = N/2. (d) The spectra of the imaginary part and those of the phase are skew-symmetric about n = N/2, and (e) The spectra in the left half of the zone n = 0, …, (N-1) are valid. The spectra in the right half are virtual and are too high compared to the sampling frequency (this is also observed while discussing the aliasing effect in equation (14.23)).