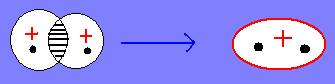
It is clearly seen that in the region between the nuclei the value of  is greater than the sum of is greater than the sum of  and and  . This feature is the central theme of chemical bonding, ie, the charge density between the nuclei is different (generally larger) than the sum of the individual charge densities of the respective atomic orbitals. We will elaborate the meaning of . This feature is the central theme of chemical bonding, ie, the charge density between the nuclei is different (generally larger) than the sum of the individual charge densities of the respective atomic orbitals. We will elaborate the meaning of  2 a little latter in this lecture. 2 a little latter in this lecture.
|