14.10.3 Removing run-out from a vibration signal
Some types of tracking filter enable run-out vectors to be automatically removed from the incoming signal, so that the true vibration vector is displaced immediately. This facility can also be programmed into data logging equipment. The nulling is also carried out between critical speeds when producing a Bode plot, as discussed earlier, to obtain information about phase for use in balancing. In this case it is not only the run-out that is removed from the incoming signal, but also components of vibration associated mainly with modes whose characteristics frequencies are lower than the frequency at which the nulling is being carried out.
Run-out correction
The rotor system has an initial run-out error mainly due to surface irregularities on the shaft. This run-out has to be subtracted from the response obtained at the bearings and the steps taken are enumerated below
- The rotor is run at a slow speed (for example 240 rpm) and the response at the bearings is recorded.
- These responses are split along the time scale for a single time period of rotation into an even number of divisions, n.
- The responses taken at higher speeds during the course of the experiment are also split along the time scale for a single time period of rotation into the same number of divisions, n.
- On subtracting the slow response data obtained in step 2 from response of step 3, the run-out error is removed from the responses.
Figure 14.44 shows the procedure for the run-out correction.
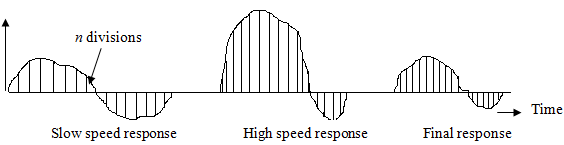
Figure 14.44 Run-out correction
14.10.4 Electronic differentiation and integration
In many instances the vibration signal is to be differentiated or integrated prior to being measured. For example, many signal conditioning devices enable accelerometer output signals to be integrated twice to provide a signal which is proportional to displacement, or alternatively they might differentiate a velocity transducer output signal to provide a measurement of acceleration. Generally, passive electronic differentiators and integrators results in a loss of signal accuracy of the order of several per cent because their mathematical foundation involves an approximation. Active devices, requiring a power source for internal amplifiers, are more accurate but are also more expensive. It is particularly important to guard against spurious signals when differentiation or integration is necessary. Since the differentiation requires that the signal is multiplied by its frequency, so that if the spurious signal is of a higher frequency than the vibration signal then after differentiation the spurious signal may appear to be far more significant. A similar effect occurs with integration when the spurious signal is of a lower frequency than the vibration signal.
During the last few years, an emerging interest has been reported on modelling rotating machines signals as cyclostationary. Some noteworthy precursory works have been concerned with the vibration signals of gears (Capdessus, et al, 2000; Bouillaut et al., 2001), rolling element bearings (McCormick, Nandi, 1998; Randall et al., 2001) and reciprocating engines (Antoni et al., 2002). It is very likely that developments in this area will keep on growing due to the promising successes of these first applications. Indeed, it is the aim of this paper to demonstrate that virtually any rotating machine signal can be regarded as being cyclostationary provided the right point of view is adopted. Cyclostationarity is a property that characterises stochastic processes whose statistical properties periodically vary with respect to some generic variable. By definition, this embodies a class of non-stationary stochastic processes, with stationary and deterministic periodic processes as special cases. Specifically due to this generality, cyclostationarity is so nicely suited to rotating machine signals. Historically, the paradigm of cyclostationarity was first introduced in communication engineering where the inherent periodicity of the signal statistics is set by the symbol duration (Bennett, 1958). It is only very recently that it was recognised cyclostationary processes fit the properties of most rotating machine signals and it can thus be used to devise new processing tools.
Final Remarks
To conclude in the present chapter, various kinds of graphical display used in depicting vibration responses from rotating machineries are presented, e.g. Bode plots, Nyquist plots, Cascade or waterfall plots, orbit plots, Campbell diagram, etc. Various aspect in vibration signal measurements are looked into like digitization error, minimum sampling rate (Nyquist frequency), aliasing effects, leakage error. Means and ways to reduce these errors during measurements are described in detail like windowing, tuning of sampling rate, etc. Various statistical properties of random signals are described like the ensemble and temporal averaging, probability distribution function, probability density, auto- correlation and cross-correlation, coherence, covariance, power spectrum, etc. Various means of protecting of actual signals from noising signals are looked into due to mechanical and electrical faults in measuring equipments and test rigs.