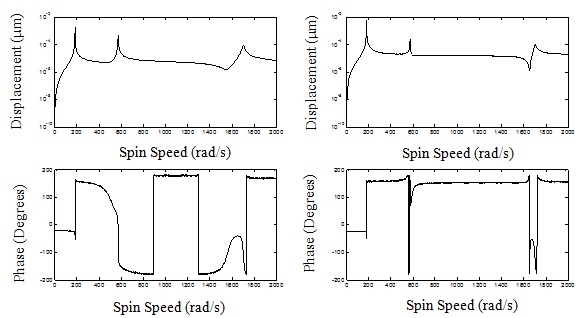
Fig. 13.34 Variation of unbalance response amplitude and phase with spin speed (residual unbalances, with damping and 3% noise) (left) for left measuring plane (right) for right measuring plane
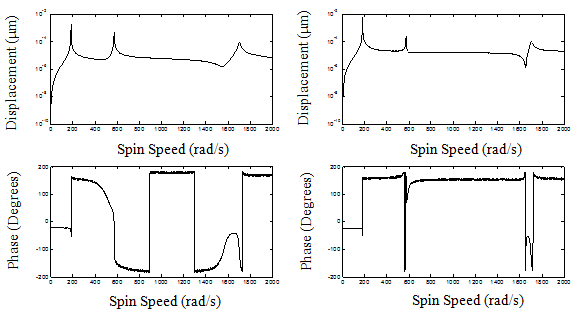
Fig. 13.35 Variation of unbalance response amplitude and phase with spin speed (residual unbalances, with damping and 5% noise) (left) for left measuring plane (right) for right measuring plane
Figures 13.32 to 13.35 show initial unbalance responses (both amplitude and phase) with spin speed of the rotor when only residual unbalance is present and there is no correction masses placed on the balancing planes. The above figures represent the imbalance response generated by the unbalance forces due to helical distribution of unbalance for various cases, viz. without damping and noise and then considering damping and noise.
Next, the proportional damping (show the calculation of Rayleigh’s coefficients) is introduced into the system and the corresponding graphs are plotted. The effect of damping may also be considered using Rayleigh’s damping factors. The damping matrix in that case is given by


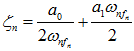
To calculate this we need two different natural frequencies from which we can calculate the Rayleigh’s damping factors. From this we can calculate the Rayleigh damping factor as
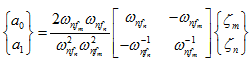

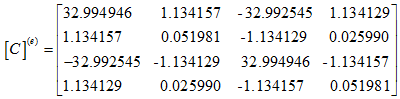
and for element number 4 to 6, where elemental length  = 0.0867 m, we have