| |
| | |
|
Model is explained based on the assumptions of stable flow and a simple uniform
arrival function.
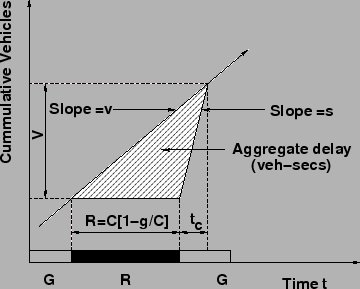
As explained in the above section, aggregate delay can be estimated as the area
between the arrival and departure curves.
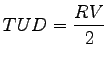
Thus, Webster's model for uniform delay is the area of the triangle formed by
the arrival and departure functions.
From Fig. 1 the area of the aggregate delay triangle is
simply one-half the base times the height. Hence, the total uniform delay (TUD) is given as:
 |
(1) |
Figure 1:
Illustration of Webster's uniform delay model
 |
where,  is the duration of red, is the duration of red,  is the number of vehicles arriving
during the time interval is the number of vehicles arriving
during the time interval  .
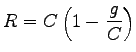
Length of red phase is given as the proportion of the cycle length which is not
green, or: .
Length of red phase is given as the proportion of the cycle length which is not
green, or:
 |
(2) |
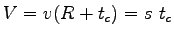
The height of the triangle is found by setting the number of vehicles arriving
during the time () equal to the number of vehicles departing in time
 , or: , or:
 |
(3) |
Substituting equation 2 for in equation 3 and
solving for and then for gives,
Substituting equation 2 and equation 4 in equation 1 gives:
where TUD is the aggregate delay, in vehicle seconds.
To obtain the average delay per vehicle, the aggregate delay is divided by the number of vehicles
processed during the cycle, which is the arrival rate,  , times the full cycle
length, , times the full cycle
length,  .
Hence, .
Hence,
Another form of the equation uses the capacity, c, rather than the saturation
flow rate, s.
We know,
 |
(6) |
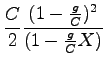
So, the relation for uniform delay changes to,
where,
UD is the uniform delay (sec/vehicle)
C is the cycle length (sec),
c is the capacity,
v is the vehicle arrival rate,
s is the saturation flow rate or departing rate of vehicles,
X is the v/c ratio or degree of saturation (ratio of the demand flow rate to saturation flow rate), and
g/C is the effective green ratio for the approach.
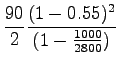
Consider the following situation: An intersection approach has an approach flow
rate of 1,000 vph, a saturation flow rate of 2,800 vph, a cycle length of 90 s,
and effective green ratio of 0.44 for the approach.
What average delay per vehicle is expected under these conditions?
First, the capacity and v/c ratio for the intersection approach must be
computed.
Given, s=2800 vphg and g/C=0.55.
Hence,
Since  and is a relatively low value, the uniform delay equation 5 may be applied directly.
There is hardly any random delay at such a v/c ratio and overflow delay need not be
considered. and is a relatively low value, the uniform delay equation 5 may be applied directly.
There is hardly any random delay at such a v/c ratio and overflow delay need not be
considered.
Therefore, average delay per vehicle is 14.2 sec/veh.
Note that this solution assumes that arrivals at the subject intersection
approach are uniform.
Random and platooning effects are not taken into account.
|
|
| | |
|
|
|

![$\displaystyle \frac{1}{2}\left[C\left(1-\frac{g}{C}\right)\right]^2\left(\frac{vs}{s-v}\right)$](img19.png)
![$\displaystyle \frac{1}{2}\left[C\left(1-\frac{g}{C}\right)\right]^2\left(\frac{vs}{s-v}\right)\left(\frac{1}{v~C}\right)$](img23.png)