| |
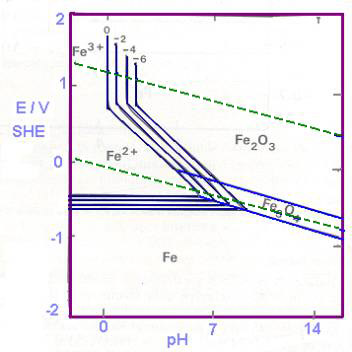
| We wish to plot the data in the above table as E vs pH (Pourbaix diagrams). These diagrams have wide applications in corrosion, electrodeposition, geological processes and hydrometallurgical extraction. These figures help us to analyze the regions where the metal is immune, where it is passive and where it gets corroded. |
| |
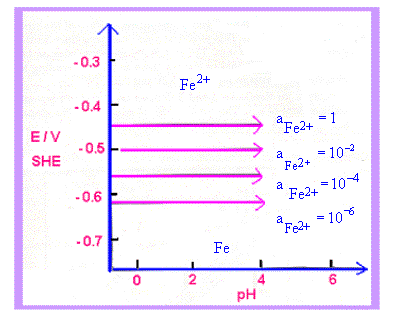
| For each reaction of Table 25.1, lines can be drawn on E vs pH diagrams. For reaction 1, E depends only on aFe2+ and not on pH as H+ ions are not involved in the reaction. For each a Fe2+, the graph is a horizontal line (Fig 25.2a). In reaction 4, no electrons are involved (not an electrode reaction) and we get vertical lines for each value of a Fe 3+. Reaction 3 involves E, pH and a Fe3+. This yields sloping lines for a given value of a Fe3+. We get negative slopes because of negative pH terms (H+ on the left side of the reaction). Reaction 2 gives single sloping lines because E and pH are involved, but not a Fe 2+. These lines are shown in fig 25.2 (b). Fig 25.2(b) also indicates the stability of water between the dotted lines. |
| |
|
| Figure 25.2 a) Potential - pH plots for the equilibrium Fe2+ + 2e - = Fe for selected values of a Fe2+ |
|
|
| Figures 25.2 (b) Potential - pH plots for the iron water system at 25oC. Domain for the stability of water is bounded by the two bent dotted lines. The labels 0, -2, -4, -6 refer to the concentrations (activities) of ferrous and ferric ions, i.e., -2 refers to a Fe2+ = a Fe3+ = 10-2. Similarly 0 refers to 100, -4 refers to 10-4 and -6 refers to 10-6. |
| |
|
| |
| |
| |
| |
| |
| |
| |
| |
| |
| |
| |
| |
| |
| |
|