RBS: Experiment
☆ One of the well-suited samples for RBS analysis is a metal silicide film. The conductivity depends on the ratio of the silicon to the metal and on the thickness of the film. Both are easily determined by RBS.
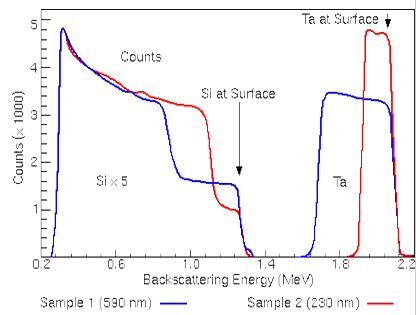
Figure 18.08: The plot of counts versus backscattering energy [1].
☆ Figure 18.08 illustrates RBS spectra from two samples: one is 230 nm thick and the other is 590 nm thick. The experiment uses an ion beam of He++ at 2.2 MeV. In both spectra, the high energy peak arises by scattering from tantalum in the TaSi film layer. The peak at lower energy is from silicon, which appears in both the TaSi film on the surface and in the Si substrate.
☆ Particles scattered from tantalum at the TaSi /Si interface of the 230 nm film have a final energy of about 1.9 MeV, while particles scattered from the same interface of the 590 nm film have less final energy (about 1.7 MeV) because they have passed through more TaSi. The entire Ta peak spans a greater energy range, because of the increased thickness of the layer it represents.
☆ The typical thickness calculation using RBS depth profile is shown in Figure 18.09.