RBS Experiment: Effect of interlayer
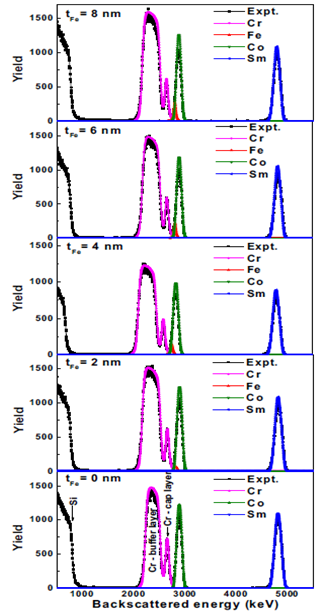
Figure 18.10: RBS spectra of the Cr(10nm)/ Fe(t nm)/ Sm-Co (20 nm)/ Cr (90nm) bilayers with different Fe thicknesses.
RBS spectra of the Fe/SmCo bilayers deposited on the Si (100) substrate are shown in Figure 18.10. The solid curves represent the simulated spectra, while the open circles show the experimental data. The simulation was performed using the SIMNRA software, which allows the determination of thickness and composition of each individual layer.
A monotonic increase in the intensity of Fe component can be observed with increasing nominal Fe layer thickness. More accurate evaluation of the composition and thickness of the diffused Fe(Co) layer by RBS is somewhat limited due to the overlapping of signals from elements such as Cr, Fe and Co because of their very similar masses. It should be noted that RBS results show that diffusion of Fe into the Sm-Co layer plays a minor role since related models did not result in better fits.
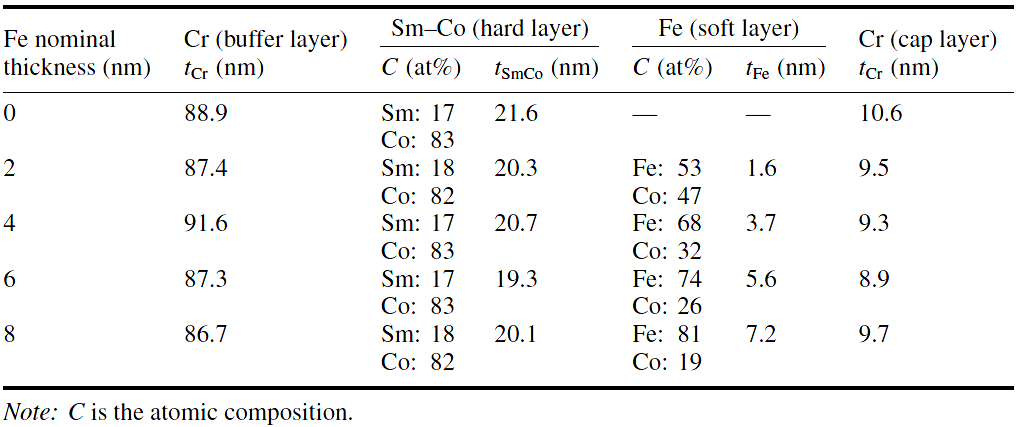
The calculated values of Fe layer thicknesses and diffused Co content in the Fe layer are presented in table.
Ref.[2]. P Saravanan et al, 2013 J. Phys. D: Appl. Phys. 46 155002.