| |
| | |
|
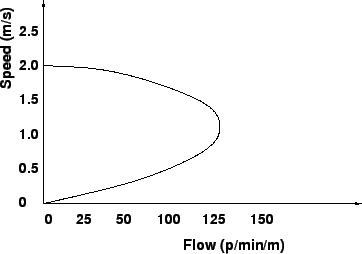
The following Fig. 1 illustrates the relationship
between pedestrian speed and flow.
These curves, similar to vehicle flow curves, show that when there are few
pedestrians on a walkway (i.e., low flow levels), there is space available to
choose higher walking speeds.
As flow increases, speeds decline because of closer interactions among
pedestrians.
When a critical level of crowding occurs, movement becomes more difficult, and
both flow and speed decline.
Figure 1:
Relationships between Pedestrian Speed and Flow
 |
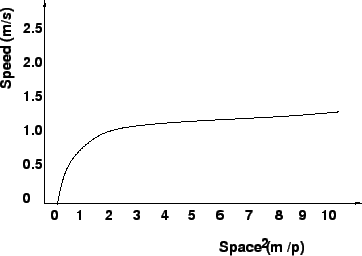
The Fig. 2 confirms the relationships of walking
speed and available space, and suggests some points of demarcation for
developing LOS criteria.
The outer range of observations indicates that at an average space of less than
1.5  /p, even the slowest pedestrians cannot achieve their desired walking
speeds.
Faster pedestrians, who walk at speeds of up to 1.8 m/s, are not able to achieve
that speed unless average space is 4.0 /p or more. /p, even the slowest pedestrians cannot achieve their desired walking
speeds.
Faster pedestrians, who walk at speeds of up to 1.8 m/s, are not able to achieve
that speed unless average space is 4.0 /p or more.
Figure 2:
Relationships between Pedestrian Speed and Space
 |
Pedestrian facility designers use body depth and shoulder breadth for minimum
space standards, at least implicitly.
A simplified body ellipse of 0.50 m * 0.60 m, with total area of 0.30 is
used as the basic space for a single pedestrian, as shown in
Fig. 3 this represents the practical minimum for standing
pedestrians.
In evaluating a pedestrian facility, an area of 0.75 is used as the buffer
zone for each pedestrian.
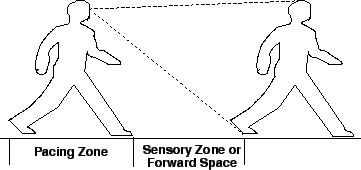
A walking pedestrian requires a certain amount of forward space.
This forward space is a critical dimension, since it determines the speed of the
trip and the number of pedestrians that are able to pass a point in a given time
period.
The forward space in the Fig 4 is categorized into a pacing
zone and a sensory zone.
Figure 3:
Pedestrian body ellipse
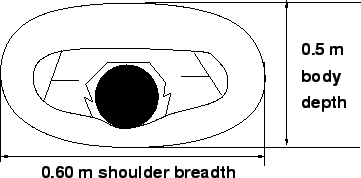 |
Figure 4:
Pedestrian walking space requirement
 |
Pedestrian walking speed is highly dependent on the proportion of elderly
pedestrians (65 years old or more) in the walking population.
If 0 to 20 per cent of pedestrians are elderly, the average walking speed is 1.2
m/s on walkways.
If elderly people constitute more than 20 per cent of the total pedestrians, the
average walking speed decreases to 1.0 m/s.
In addition, a walkway upgrade of 10 per cent or more reduces walking speed by
0.1 m/s.
On sidewalks, the free-flow speed of pedestrians is approximately 1.5 m/s.
There are several other conditions that could reduce average pedestrian speed,
such as a high percentage of slow-walking children in the pedestrian flow.
A pedestrian start-up time of 3 s is a reasonable midrange value for evaluating
crosswalks at traffic signals.
A capacity of 75p/min/m or 4,500p/h/m is a reasonable value for a pedestrian
facility if local data are not available.
At capacity, a walking speed of 0.8 m/s is considered a reasonable value.
|
|
| | |
|
|
|