| |
| | |
|
In many ways pedestrian flow are similar to those used for vehicular flow
because it can be described in terms of familiar variables such as speed,
volume, rate of flow and density.
Other measures related specifically to pedestrian flow include the ability to
cross a pedestrian traffic stream, to walk in the reverse direction of a major
pedestrian flow, to manoeuvre generally without conflicts and changes in walking
speed, and the delay experienced by pedestrians at signalized and unsignalized
intersections.
It is dissimilar to the vehicular flow in that pedestrian flow may be
unidirectional, bidirectional, or multi-directional.
Pedestrian do not always travel in clear "lanes" although they may do sometimes
under heavy flow.
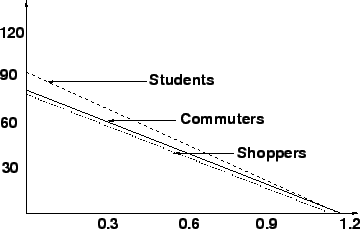
The fundamental relationship between speed, density, and volume for pedestrian
flow is analogous to vehicular flow.
As volume and density increase, pedestrian speed declines.
As density increases and pedestrian space decreases, the degree of mobility
afforded to the individual pedestrian declines, as does the average speed of the
pedestrian stream, it is shown in Fig. 1.
Figure 1:
Relationship between pedestrian speed and density
 |
The relationship among density, speed, and flow for pedestrians is similar to
that for vehicular traffic streams, and is expressed in equation.
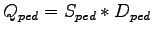 |
(1) |
where,
 = unit flow rate (p/min/m), = unit flow rate (p/min/m),
 = pedestrian speed (m/min), and = pedestrian speed (m/min), and
 = pedestrian density (p/ = pedestrian density (p/ ).
Pedestrian density is an awkward variable in that it has fractional values in
pedestrian per square meter.
This relationship often expressed in terms of Space module(M) which is the
inverse of pedestrian density.
The inverse of density is more practical unit for analyzing pedestrian
facilities ,so expression becomes ).
Pedestrian density is an awkward variable in that it has fractional values in
pedestrian per square meter.
This relationship often expressed in terms of Space module(M) which is the
inverse of pedestrian density.
The inverse of density is more practical unit for analyzing pedestrian
facilities ,so expression becomes
 |
(2) |
where M in( ).
The basic relationship between flow and space, recorded by
several researchers, is illustrated in the Fig. 2. ).
The basic relationship between flow and space, recorded by
several researchers, is illustrated in the Fig. 2.
Figure 2:
Relationship between pedestrian space & flow
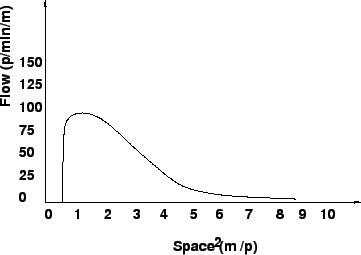 |
The conditions at maximum flow represent the capacity of the walkway facility.
From Fig. 2, it is apparent that all observations of
maximum unit flow fall within a narrow range of density, with the average space
per pedestrian varying between 0.4 and 0.9 /p.
Even the outer range of these observations indicates that maximum flow occurs at
this density, although the actual flow in this study is considerably higher than
in the others.
As space is reduced to less than 0.4 /p, the flow rate declines
precipitously.
All movement effectively stops at the minimum space allocation of 0.2 to 0.3
/p.
|
|
| | |
|
|
|