| |
| | |
|
The means of different sample taken from the same population are distributed
normally about the true mean of population with a standard deviation, is known
as standard error.
 |
(1) |
Generally, sample sizes of 50 to 200 vehicles are taken. In that case, standard
error of mean is usually under the acceptable limit.
If precision is prior then minimum no. of sample should be taken, that can be
measured by using the following equation.
 |
(2) |
where,  is the no. of sample required, is the no. of sample required,  is the Standard
deviation, Z is value calculated from Standard Normal distribution Table for a
particular confidence level (i.e. for 95% confidence Z=1.96 and for 99.7%
confidence Z=3.0) and Se is the permissible (acceptable) error in mean
calculation.
Confidence intervals express the range within which a result for the whole
population would occur for a particular proportion of times an experiment or
test was repeated among a sample of the population.
Confidence interval is a standard way of articulate the statistical accuracy of
an experiment based assessment.
If assess has a high error level, the equivalent confidence interval will be
ample, and the less confidence we can have that the experiment results depict
the situation among the whole population.
When quoting confidence It is common to refer to the some confidence interval
around an experiment assessment or test result. So, the confidence interval for
estimated true mean speed can be calculated by is the Standard
deviation, Z is value calculated from Standard Normal distribution Table for a
particular confidence level (i.e. for 95% confidence Z=1.96 and for 99.7%
confidence Z=3.0) and Se is the permissible (acceptable) error in mean
calculation.
Confidence intervals express the range within which a result for the whole
population would occur for a particular proportion of times an experiment or
test was repeated among a sample of the population.
Confidence interval is a standard way of articulate the statistical accuracy of
an experiment based assessment.
If assess has a high error level, the equivalent confidence interval will be
ample, and the less confidence we can have that the experiment results depict
the situation among the whole population.
When quoting confidence It is common to refer to the some confidence interval
around an experiment assessment or test result. So, the confidence interval for
estimated true mean speed can be calculated by
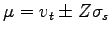 |
(3) |
where,  is the confidence interval, is the confidence interval,  is mean speed, is
standard deviation and Z is constant for specified confidence. is mean speed, is
standard deviation and Z is constant for specified confidence.
|
|
| | |
|
|
|