Measures describe the extent to which data spreads around the center of the
distribution.
Measures of dispersion include the different percentile speeds i.e. 15th,
85th,etc. and the standard deviation.
The most common statistical measure of dispersion in a distribution is the
standard deviation.
It is a measure of how far data spreads around the mean value.
In simple terms, the standard deviation is the average value of the difference
between individual observations and the average value of those observations.
The Standard deviation,  , of the sample can be calculated by , of the sample can be calculated by
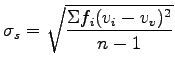 |
(1) |
The 85th and 15th percentile speeds give a general description of the high and
low speeds observed by most reasonable drivers.
It is generally thought that the upper and lower 15% of the distribution
represents speeds that are either too fast or too slow for existing conditions.
These values are found graphically from the cumulative frequency distribution
curve of Figure 6.4.
The curve is entered on the vertical axis at values of 85% and 15%. The
respective speeds are found on the horizontal axis.
The 85th and 15th percentile speeds can be used to roughly estimate the
standard deviation of the distribution
 , although this is not
recommended when the data is available for a precise determination. , although this is not
recommended when the data is available for a precise determination.
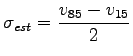 |
(2) |
The 85th and 15th percentile speeds give insight to both the central tendency
and dispersion of the distribution.
As these values get closer to the mean, less dispersion exists and the stronger
the central tendency of the distribution becomes.
The 98th percentile speed is also determining from the cumulative
frequency curve, this speed is generally used for geometric design of the road.
|