| |
| | |
|
In order to use this model for any traffic stream, one should get the boundary
values, especially free flow speed ( ) and jam density ( ) and jam density ( ).
This has to be obtained by field survey and this is called calibration process.
Although it is difficult to determine exact free flow speed and jam density
directly from the field, approximate values can be obtained from a number of
speed and density observations and then fitting a linear equation between them.
Let the linear equation be ).
This has to be obtained by field survey and this is called calibration process.
Although it is difficult to determine exact free flow speed and jam density
directly from the field, approximate values can be obtained from a number of
speed and density observations and then fitting a linear equation between them.
Let the linear equation be
 such that such that  is density is density  and and  denotes the speed
  .
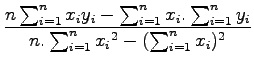
Using linear regression method, coefficients .
Using linear regression method, coefficients  and and  can be solved as, can be solved as,
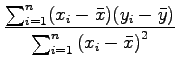
Alternate method of solving for b is,
where  and and  are the samples, are the samples,  is the number of samples, and is the number of samples, and  and and  are the mean of and respectively.
For the following data on speed and density, determine the parameters of the
Greenshield's model. Also find the maximum flow and density corresponding to a
speed of 30 km/hr. are the mean of and respectively.
For the following data on speed and density, determine the parameters of the
Greenshield's model. Also find the maximum flow and density corresponding to a
speed of 30 km/hr.
| k |
v |
| 171 |
5 |
| 129 |
15 |
| 20 |
40 |
| 70 |
25 |
Denoting y = v and x = k, solve for a and b using equation 2 and
equation 3.
The solution is tabulated as shown below.
| x(k) |
y(v) |
(
 ) ) |
(
 ) ) |
(
)(
) |
(
 ) ) |
| 171 |
5 |
73.5 |
-16.3 |
-1198.1 |
5402.3 |
| 129 |
15 |
31.5 |
-6.3 |
-198.5 |
992.3 |
| 20 |
40 |
-77.5 |
18.7 |
-1449.3 |
6006.3 |
| 70 |
25 |
-27.5 |
3.7 |
-101.8 |
756.3 |
| 390 |
85 |
|
|
-2947.7 |
13157.2 |
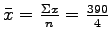 = 97.5, = 97.5,
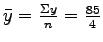 = 21.3.
From equation 3, b = = 21.3.
From equation 3, b =
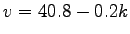
 = -0.2 = -0.2
 = 21.3 + 0.2 = 21.3 + 0.2 97.5 = 40.8
So the linear regression equation will be, 97.5 = 40.8
So the linear regression equation will be,
 |
(4) |
Here = 40.8 and
 = 0.2.
This implies, = 0.2.
This implies,
 = 204 veh/km.
The basic parameters of Greenshield's model are free flow speed and jam density
and they are obtained as 40.8 kmph and 204 veh/km respectively.
To find maximum flow, use equation = 204 veh/km.
The basic parameters of Greenshield's model are free flow speed and jam density
and they are obtained as 40.8 kmph and 204 veh/km respectively.
To find maximum flow, use equation ![[*]](file:/usr/local/share/lib/latex2html/icons/crossref.png) , i.e., , i.e.,
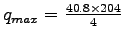 = 2080.8 veh/hr
Density corresponding to the speed 30 km/hr can be found out by substituting = 2080.8 veh/hr
Density corresponding to the speed 30 km/hr can be found out by substituting  in equation 4. i.e,
30 = 40.8 - 0.2 k
Therefore, k = in equation 4. i.e,
30 = 40.8 - 0.2 k
Therefore, k =
 = 54 veh/km. = 54 veh/km.
|
|
| | |
|
|
|