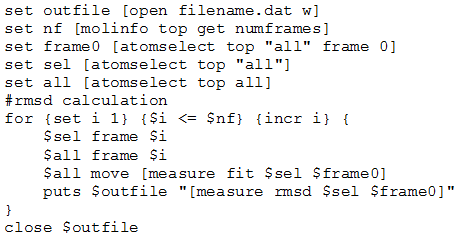
Usage:
Here the ‘filename.psf’ and ‘filename.dcd’ should be first opened one by one in the visualize(VMD:Visual Molecular Dynamics) and then the script should be run.
It shows that both the cations and anions follow a similar path of diffusion (Fig 10).The diffusivity coefficient for [Bmim][PF6] (taken as a average of cation and anion) is very low (9.26 x 10⁻¹² m2/s) as compared to water (2.38 m2/s). Local structure of cations and anions has been estimated via the radial distribution function at T=298.15 K and 1 bar pressure .For calculating the radial distribution function the various frames at each time step needs to be extracted from the DCD or the trajectory file. A simple tcl script (http://www.ks.uiuc.edu/Research/vmd/script_library/) does the following:
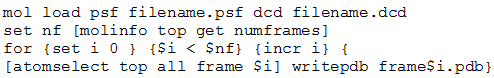
Usage:
Here the ‘filename.psf’ and ‘filename.dcd’ should be first opened one by one in VMD and then the script should be run.
We can see from the RDF in Fig 11 that there are two solvation shells - one at 3.90 Å and the second at 9.08 Å; these compare well with the values of 4.3 and 10.6 Å as obtained by Morrow and Maginn,2002. The coordination number is calculated using the integral of RDF from zero to the value of first minimum (Rmin1). It is given by:
![]()