Table 3: Experimental vs simulated values of ![]() for [Bmim][PF6]
for [Bmim][PF6]
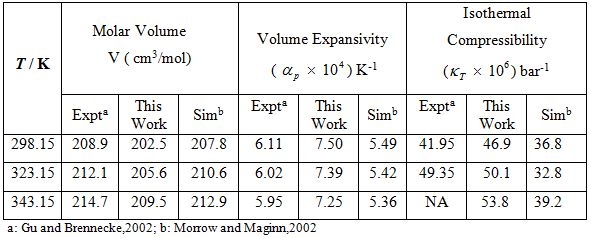
The volume expansivity is computed by running a series of NPT simulations at the same pressure i.e 1 atm but at temperatures (T = 298.15, 323.15, 343.15). Because the change of volume with temperature is approximately linear, it can be calculated by fitting a straight line to the simulated molar volume data at different temperatures. The volume expansivity decreases with temperature which is a good agreement with literature.
Additionally the cohesive energy densities, cation and anion diffusivities and ionic conductivities have been determined using equations given in the earlier modules respectively. Comparison with the simulated results of Morrow and Maginn, (2002) is given in Table 4.
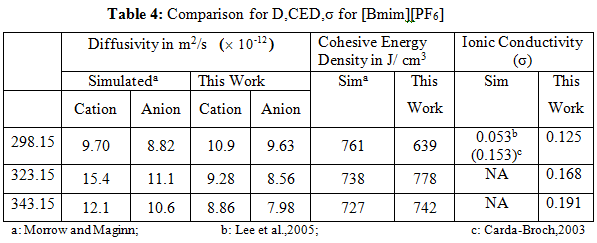
The experimental values of diffusivity and cohesive energy density are not available. However both the values are within (10-30) % of the reported simulated values[Morrow and Maginn,2002].
The self diffusivities of cation and anion are found out by plotting the mean square displacement versus time for the centre of mass of cation and anion separately. The tcl script (http://www.ks.uiuc.edu/Research/vmd/script_library/) for computing the mean square deviation from trajectory file is written below: