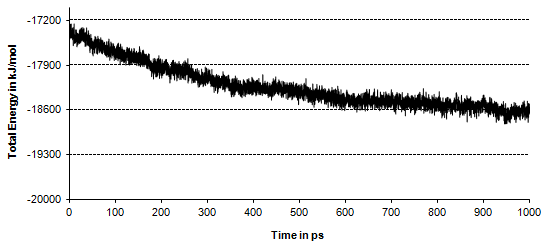
Figure 7: Total Energy versus time for [Bmim][PF6] at T=323.15 K
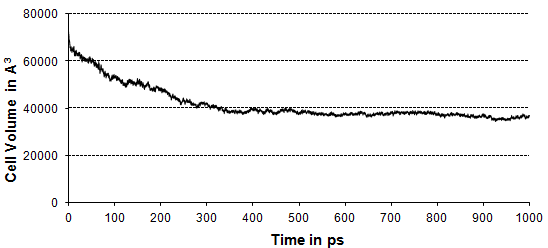
Figure 8: Cell Volume vs Time for [Bmim][PF6] at T=323.15 K
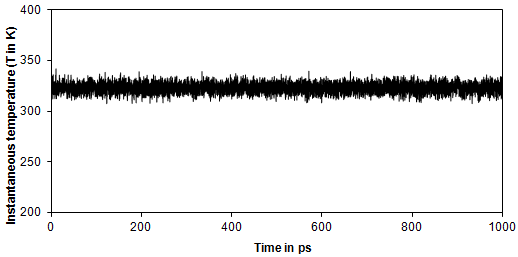
Figure 9: Temperature vs Time for [Bmim][PF6] at T = 323.15 K
The variation of total energy, cell volume and temperature with time is shown in Figures 7, 8 and 9 respectively. For the cell volume, since we started with a lower density the values were higher initially but the volume slowly decreases to a constant value of 38,000 Ǻ3 from 300 ps onwards. This shows that the volume now is equal to that consistent with the force field parameters. Similar pattern was also observable in case of total energy where the energies level off at -18,600 kJ/mol.
Validation of Pure Component Properties
The molar volumes, isothermal compressibility and volume expansivity at the three temperatures are predicted and compared with the experimental results in Table 3.The molar volume increases with temperature and is ~3% less than the experimental values. The volume expansivities ![]() and isothermal compressibilities
and isothermal compressibilities ![]() calculated using equations 53 and 54, were found to be greater than the experimental values by ~20% and ~6% respectively. It was found that the molar volumes and isothermal compressibilities increases with temperature while volume expansivities decreases with temperature.
calculated using equations 53 and 54, were found to be greater than the experimental values by ~20% and ~6% respectively. It was found that the molar volumes and isothermal compressibilities increases with temperature while volume expansivities decreases with temperature.