On plotting initial rate ri as a function of total pressure pt, a typical curve as shown in Fig 4A is obtained. Hence if kinetic data for a reaction give similar plot then it can be deduced that the reaction is surface reaction controlled.
When adsorption of A is controlling the dependence of initial rate on total pressure can be derived in similar way as
![]()
Where ![]()
For this mechanism a typical plot of initial rate ri as a function of total pressure pt is shown in Fig. 4B. When reaction data satisfy this plot then the reaction is said to be adsorption A controlling. In similar way other models can be tested for fitting.
However, it should be noted that though the initial rate analysis is simple and can reduce the number of rate expressions to be tested against the experimental but cannot substitute a differential or integral analysis. It should be used as only as preliminary kinetic analysis method.
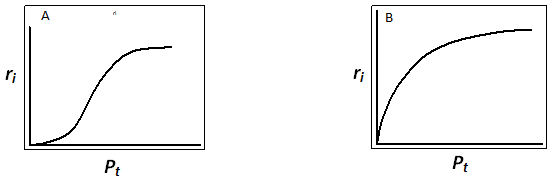
Fig. 4. Typical plot for initial rate vs total pressure for reactions ![]() when equimolal mixture of A and B is used. A) surface reaction controlling B) adsorption of A controlling
when equimolal mixture of A and B is used. A) surface reaction controlling B) adsorption of A controlling
Book Reference
• J. M. Smith, Chemical Engineering Kinetics, McGrawHill Book Company, 1981
• H. S. Fogler, Elements of Chemical reaction engineering, Prentice Hall of India., 1999
• R. J. Farrauto& C. H. Bartholomew, Fundamentals of Industrial catalytic Processes, Blackie Academic & Professional, 1997
• O. Levenspiel, Chemical reaction engineering, John Wiley & sons. 1995
• J.J. Carberry, Chemical and catalytic reaction Engineering, Dover Publications, 2001.