Differential analysis of rate data
In this method the data are collected as in previous case. A plot of conversions XA versus W/FAo is made for each set of runs at a fixed temperature (Fig. 2). A best fit of data is made. Tangent to the fitted curve are drawn at regular interval along the curve corresponding to the best fit. The slopes of this tangent are evaluated which correspond to the reaction rate ![]()
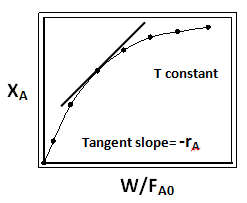
Fig. 2. Typical plot of XA vs W/FA0 for determination of rate from tangent slope in differential analysis of data
Tangents can be evaluated more accurately by differentiating the equation for best fit of data and evaluating the derivative at various intervals over the data set. Values of –rA versus CA are plotted to determine the reaction orders. For example for an irreversible reactions in which data are fitted by a simple power rate law ![]() , a plot of ln(-rA) vs ln CA is linear with a slope of order n. If rate vs temperature data available then it is possible to determine the apparent activation energy from Arrhenius equation k = A exp(-E/RT). The slope of the plot of ln k vs 1/T gives the activation energy E of the reaction.
, a plot of ln(-rA) vs ln CA is linear with a slope of order n. If rate vs temperature data available then it is possible to determine the apparent activation energy from Arrhenius equation k = A exp(-E/RT). The slope of the plot of ln k vs 1/T gives the activation energy E of the reaction.
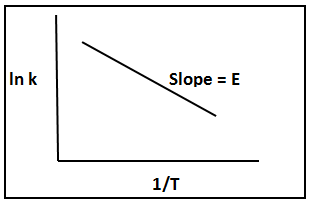
Fig. 3. A typical Arrhenius plot for determination of activation energies