The value of R , the internal resistance of the cell, will normally be different when charging as opposed to discharging. To use a value twice the size of the discharge value is a good first approximation.
When running a simulation, we must remember that the power P is positive, and that Eq. 18 gives the current into the battery. So when incorporating regenerative braking into battery simulation, care must be taken to use the right equation for the current, and that Eq. 18 must be modified so that the charge removed from the battery is reduced . Also, it is important to remove the Peukert Correction, as when charging a battery large currents do not have proportionately more effect than small ones. Eq. 17 thus becomes:
| (19) |
- Calculating the Peukert Coefficient
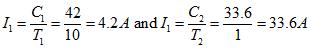
These equations and simulations are very important, and will be used again when we model the performance of electric vehicles. There the powers and currents will not be constant, as they were above, but exactly the same equations are used. However, all this begs the question ‘How do we find out what the Peukert Coefficien. It is very rarely given on a battery specification sheet, but fortunately there is nearly always sufficient information to calculate the value. All that is required is the battery capacity at two different discharge times. For example, the nominally 42 Ahr (10 hour rating) battery of Fig. 1 also has a capacity of 33.6 Ahr at the 1 hour rate. The method of finding the Peukert Coefficient from two Ahr ratings is as follows. The two different ratings give two different rated currents:
| (20) |
We then have two equations for the Peukert Capacity, as in Eq. 3:
| (21) |
However, since the Peukert Coefficient is Constant, the right hand sides of both parts of Eq. 21 are equal, and thus:
 |
(22) |
Taking logs, and rearranging this gives:
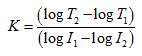 |
(23) |
This equation allows us to calculate the Peukert Coefficient k for a battery, provided we have two values for the capacity at two different discharge times T . Taking the example of our 42 Ah nominal battery, Eq. 22 becomes:
 |
(24) |
Putting these values into Eq. 23 gives:
| (25) |
Such calculations can be done with any battery, provided some quantitative indication is given as to how the capacity changes with rate of discharge. If a large number of measurements of capacity at different discharge times are available, then it is best to plot a graph of log (T) against log (I) . Clearly, from Eq. 30, the gradient of the best-fit line of this graph is the Peukert Coefficient.