3.4 Concurrent Fault Simulation
From the discussion in the in the last section we found that detective fault simulation can determine all the faults in one iteration detectable by a random pattern. However, when a new random pattern is fed as input the whole process needs to be redone. “Concurrent Fault Simulation” is a technique similar to deductive fault simulation, however, retains information when moving from one random pattern to another. In other words, in concurrent fault simulation when a new random pattern is fed it needs to compute only that information which got changed by the new pattern. So, concurrent fault simulation gets motivation from the advantages achieved by event driven simulation compared to compiled code simulation.
In concurrent fault simulation to each gate is associated a number of gates “affected by some fault in the circuit”. An affected gate is one whose at least one input or output is different from the ones in the original (normal gate). An example of such affected gates being added to an AND gate is given in Figure 16. In the example the input to the AND gate is I1=1 and I2=1. Now due to three faults, namely (i) s-a-0 at I1, denoted as I10(ii) s-a-0 at I2, denoted as I20 and (iii) s-a-0 at OG1, denoted as OG10, some signals in the input or output of the AND gate differs compared to normal condition. So three AND gates “affected” by fault is attached to the AND gate. For example, in Figure 16 due to s-a-0 fault at I1, signal I1 at AND gate is 0 while it is 1 at normal condition; first gate of the “affected gate” list corresponds to this case. Also, the output of the AND gate is 0 under fault (versus 1 at normal condition). This fact is also captured by the first affected gate. Similarity all the other two affected gates can be explained.
Figure 16. Fault affected gates being added to an AND gate (Concurrent Simulation)
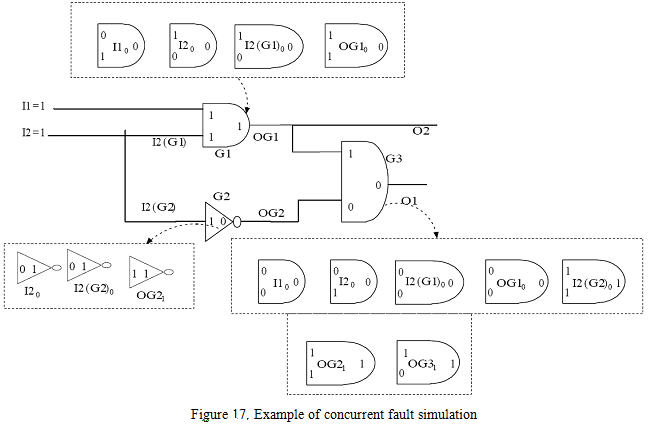
Given a circuit, level wise affected gates corresponding to all normal gates are created. Now, affected gates (in the list of normal gates) that drive some primary output are considered. Among those affected gates, the ones whose output signal value differs from that of the normal gate, correspond to faults being detected by the random pattern given as input. This is explained by an example given in Figure 17.
In Figure 17, AND gate G1 can be affected by four faults, namely (i) s-a-0 at I1, (ii) s-a-0 I2, (iii) s-a-0 at I2(G2) and (iv) s-a-0 at OG1. So four affected gates with signals corresponding to the faults are shown in the list of G1. As G2 does not drive any primary output, so fault detectability is not computed for the list at G2. Similarly, NOT gate G2 can be affected by three faults, namely (i) s-a-0 at I2, (ii) s-a-0 I2(G2) , (iii) s-a-1 at OG2. So three affected gates with signals corresponding to the faults are shown in the list of G2. As G2 does not drive any primary output, so fault detectability is not computed for the list at G2.