| |
| | |
|
It is the procedure of assessment of the safety measures employed for the road.
It has the advantages like proper planning and decision from beforehand ensures
minimization of future accidents, the long term cost associated with planning is also reduced and enables all kinds of users to perceive clearly how to use it safely.
Safety audit takes place in five stages as suggested by Wrisberg and Nilsson, 1996.
Five Stages of Safety Audit are:
- Feasibility Stage - The starting point for the design is determined such as number and type of intersection, relationship of the new scheme to the existing road, the relevant design standards.
- Draft Stage - In this stage horizontal and vertical alignment, junction layout are determined.
After the completion of this stage decision about land acquisition is taken.
- Detailed design stage - Signing, marking, lighting, other roadside equipment and landscaping are determined.
- Pre-opening stage - Before opening a new or modified road should
be driven, walked or cycled.
It should be done at different condition like bad weather, darkness.
- Monitoring of the road in use - Assessment is done at the final stage after the road has been in operation for few months to determine whether the utilization is obtained as intended and whether any adjustment to the design are required in the light of the actual behavior of road users.
An example of safety audit is discussed below.
To estimate the effectiveness of improvement of dangerous section the number of accidents before and after is compared.
To do this Chi Square test is used to check whether the experimental data meet the allowable deviation from the theoretical analysis.
In the simplest case one group of data before and after road reconstruction is considered.
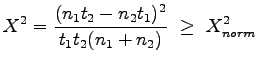 |
(1) |
where,  and and  = period of time before and after reconstruction of a stretch of
road for which statistical data of accident is available, = period of time before and after reconstruction of a stretch of
road for which statistical data of accident is available,  and and  = corresponding numbers of accident, = corresponding numbers of accident,
 = minimum values of Chi Square at which probability of deviation
of laws of accident occurrence after reconstruction P from the laws existing before reconstruction does not exceed permissible values (usually 5%)
The relationship between P and
is shown in
Table. 1. = minimum values of Chi Square at which probability of deviation
of laws of accident occurrence after reconstruction P from the laws existing before reconstruction does not exceed permissible values (usually 5%)
The relationship between P and
is shown in
Table. 1.
Table 1:
Relationship between P and
| P |
10 |
8 |
5 |
3 |
2 |
1 |
0.1 |
|
|
1.71 |
2 |
2.7 |
3.6 |
4.25 |
5.41 |
9.6 |
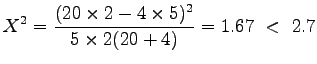
Before reconstruction of an at-grade intersection, there were 20 accidents during 5 years.
After reconstruction there were 4 accidents during 2 years.
Determine the effectiveness of the reconstruction.
Using Chi square test, we have (with P = 5 %)
Thus the statistical data available are not yet sufficient for considering with probability of 95 % that the relative reduction in number of accident is due to intersection reconstruction.
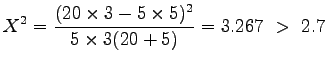
Assuming one more accident occurs next year.
Therefore additional analysis confirms that the reduction in accident is due to
road reconstruction.
|
|
| | |
|
|
|