| |
| | |
|
The problem of accident is a very acute in highway transportation due to complex flow pattern of vehicular traffic, presence of mixed traffic along with pedestrians.
Traffic accident leads to loss of life and property.
Thus the traffic engineers have to undertake a big responsibility of providing safe traffic movements to the road users and ensure their safety.
Road accidents cannot be totally prevented but by suitable traffic engineering and management the accident rate can be reduced to a certain extent.
For this reason systematic study of traffic accidents are required to be carried out.
Proper investigation of the cause of accident will help to propose preventive measures in terms of design and control.
Some objectives of accident studies are listed below:
- To study the causes of accidents and suggest corrective measures at
potential location
- To evaluate existing design
- To compute the financial losses incurred
- To support the proposed design and provide economic justification to the
improvement suggested by the traffic engineer
- To carry out before and after studies and to demonstrate the improvement in the problem.
The various causes of road accidents are:
- Road Users - Excessive speed and rash driving, violation of traffic rules, failure to perceive traffic situation or sign or signal in adequate time, carelessness, fatigue, alcohol,sleep etc.
- Vehicle - Defects such as failure of brakes, steering system, tyre burst,lighting system .
- Road Condition - Skidding road surface, pot holes, ruts.
- Road design - Defective geometric design like inadequate sight distance, inadequate width of shoulders, improper curve design, improper traffic control devices and improper lighting,.
- Environmental factors -unfavorable weather conditions like mist, snow, smoke and heavy rainfall which restrict normal visibility and and makes driving unsafe.
- Other causes -improper location of advertisement boards, gate of level crossing not closed when required etc..
The statistical analysis of accident is carried out periodically at critical locations or road stretches which will help to arrive at suitable measures to effectively decrease accident rates.
It is the measure (or estimates) of the number and severity of accident.
These statistics reports are to be maintained zone-wise.
Accident prone stretches of different roads may be assessed by finding the accident density per length of the road.
The places of accidents are marked on the map and the points of their clustering (BLACK SPOT) are determined.
By statistical study of accident occurrence at a particular road or location or zone of study for a long period of time it is possible to predict with reasonable accuracy the probability of accident occurrence per day or relative safety of different classes of road user in that location.
The interpretation of the statistical data is very important to provide insight to the problem.
The position of India in the year 2009 in country-wise number of person killed per 100000 populations as shown in the Figure 1 and the increase in rate of accident from year 2005 to year 2009 is shown in the table. 1.
In 2009, 14 accidents occurred per hour.
Figure 1:
Country-wise number of person killed per 100000 populations (Ref.
Ministry of Road Transport and Highways Transport Research Wing)
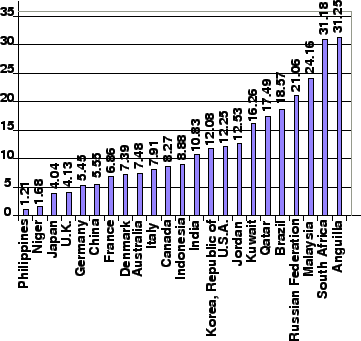 |
Table 1:
Number of Accidents and Number of Persons Involved : 2001 to 2009(Ref. Ministry of Road Transport and Highways Transport Research Wing)
| |
No. of Accidents |
No. of persons affected |
Accident severity |
| Year |
Total |
Fatal |
Killed |
Injured |
(No. of persons killed |
| |
|
|
|
|
per 100 accidents) |
| 2005 |
4,39,255 |
83,491 |
94,968 |
4,65,282 |
22 |
| 2006 |
4,60,920 |
93,917 |
1,05,749 |
4,96,481 |
23 |
| 2007 |
4,79,216 |
1,01,161 |
1,14,444 |
5,13,340 |
24 |
| 2008 |
4,84,704 |
1,06,591 |
1,19,860 |
5,23,193 |
25 |
| 2009 |
4,86,384 |
1,10,993 |
1,25,660 |
5,15,458 |
25.8 |
Figure 2:
Percent share in total road accident by type of motor vehicle involved
(Primary responsible) in year 2009 (Ref. Ministry of Road Transport and Highways
Transport Research Wing)
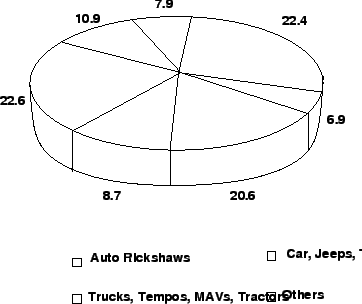 |
Figure 3:
Causes of road accident in year 2009 (Ref. Ministry of Road Transport and Highways Transport Research Wing)
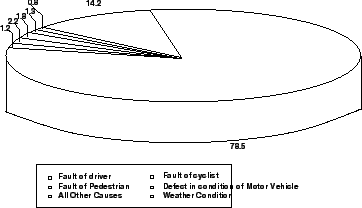 |
Figure 2 and 3 gives the percent of accident occurring from a specific vehicle class and the causes of accident in the form of pie-chart.
Since the data collection of accident is mostly done by the traffic police it’s the users who are put to blame in majority of cases.
Thus such statistical records are not much useful for the traffic engineer.
|
|
| | |
|
|
|