2. Water Quality for Irrigation
Turbidity, Water temperature, BOD/COD
Salinity/Sodium SAR(Sodium Adsorption Ratio)
SAR = Na+ /(sqrt(Ca2++ Mg2+)
Toxicity: Boron (0.5 to 0.7 g/m3), Selenium
3. Amount and Frequency of Irrigation
(1) The depth and distribution of plant roots (species, hardpans, other physical properties)
(2) Water holding capacity in the rooting zone (soil pore sizes and total amount)
(3) Minimum target water potential (above the permanent wilting point~ -1.5 MPa)
(4) Rate of water consumption (ET)
(5) Efficiency of application (the loss factor)
(6) Availability of irrigation water
Now databases are available for most places, so irrigation can be programmed using weather station data and set target.
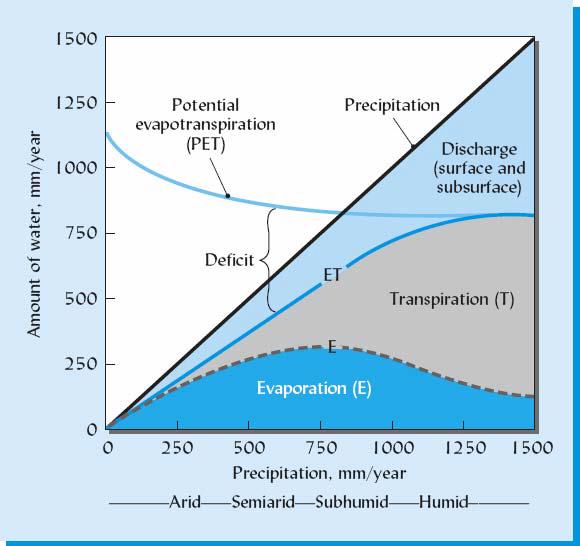 |
Partitioning of liquid water losses (discharge) and vapor losses (evaporation and transpiration) in regions varying from low (arid) to high (humid) levels of annual precipitation. The example shown assumes that temperatures are constant across the regions of differing rainfall. Potential evapotranspiration (PET) is somewhat higher in the low rainfall zones because the lower relative humidity there increases the vapor pressure gradient at a given temperature. Evaporation (E) represents a much greater proportion of total vapor losses (ET) in the drier regions due to sparse plant cover caused by interplant competition for water. The greater the gap between PET and ET, the greater the deficit and the more serious the water stress to which plants are subject. (Diagram courtesy of R. Weil) |