Attenuated Total Reflectance – Fourier Transform Infrared Spectrometer (ATR-FTIR)
An ATR-FTIR works on the principle of total internal reflection and the evanescent field (Figure 10.5). The refractive index of the ATR crystal (usually Zinc selenide, diamond, Germanium) is significantly higher than that of the samples that are to be studied. An IR beam gets refracted at the interface of the ATR material and the sample (Figure 10.5A).
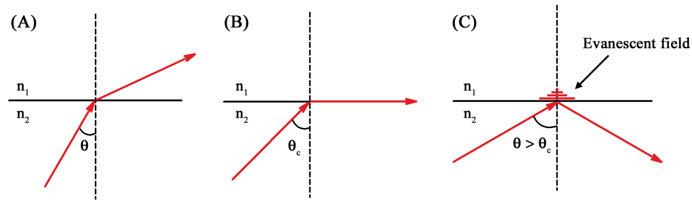
Figure 10.5 Phenomenon of total internal reflection. Notice the exponentially decaying evanescent field in the medium of lower refractive index (n1) |
If the angle of incidence, θ is more than the critical angle, θc (Figure 10.5B and C), the beam gets totally internally reflected. Before getting totally reflected, however, an exponentially decaying field penetrates into the medium of low refractive index. This field is called an evanescent field and can interact with the molecules that are in the close proximity of the ATR crystal. If some part of the evanescent field is absorbed by the molecules, the reflected beam will be attenuated (become less intense) by this factor. The reflected beam will therefore be of lesser intensity implying absorption of radiation. The commercially available ATR instruments are FTIR spectrometers. ATR-FTIR allows studying the samples like thin films, powders, pastes by directly placing the sample on the ATR crystal.
Functional group region and fingerprint region
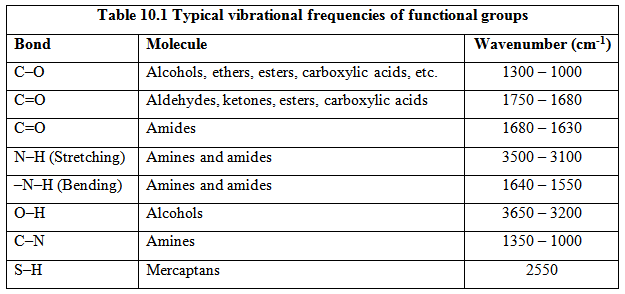
The most common application of IR spectroscopy is perhaps to identify the functional groups. This is possible because different functional groups vibrate at different frequencies allowing their identification. The frequency of vibration, however, depends on additional factors such as delocalization of electrons, H-bonding, and substitutions at the nearby groups. The wavenumbers for some of the bonds are shown in Table 10.1.
The absorption bands in the 4000 – 1500 cm-1 region allows identification of functional groups ; this region therefore is also termed the functional group region of the IR spectrum (Figure 10.6). The lower energy portion of the mid-IR region (1500 – 400 cm-1) usually contains a very complicated set of peaks arising due to complex vibrations involving several atoms. This region is unique to a particular compound and therefore is known as the fingerprint region of the IR spectrum. Though it is difficult to assign the vibrational modes to these peaks, these are useful to identify a compound if the spectrum of the compound is already known.
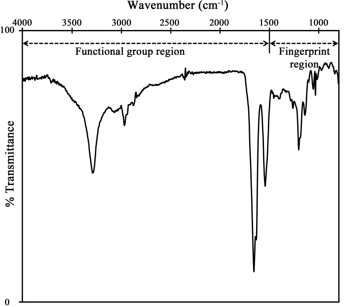
Figure 10.6. A typical IR spectrum showing functional group and fingerprint regions