Module 5 : Signal Distortion on Optical Fibers - Dispersion
Lecture 1 : Signal Distortion on Optical Fibers - Dispersion
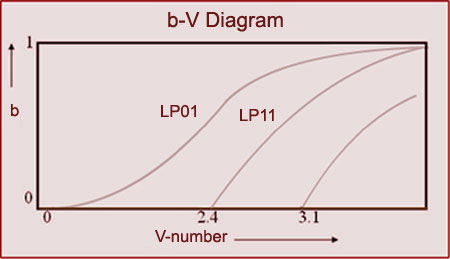
The relation can be equivalently described by b-V relation. The b-V diagram of a step index optical fiber for different modes is shown in the following.
As can be seen clearly, the b-V diagram is not linear and consequently, there is dispersion.
The waveguide dispersion due to non-linear b-V diagram is obtained as
From the b-V diagram we can calculate , and subsequently the waveguide dispersion.
The peaks around V=1.2 for the lowest order mode. Consequently, in the single mode optical fiber the dispersion is maximum around V = 1.2.
For higher V-number the dispersion is low. However, as pointed out earlier, for the fiber to be single mode, V < 2.4.
The single mode optical fibers therefore have V-number very close to but less than 2.4 so that they have lowest possible waveguide dispersion.
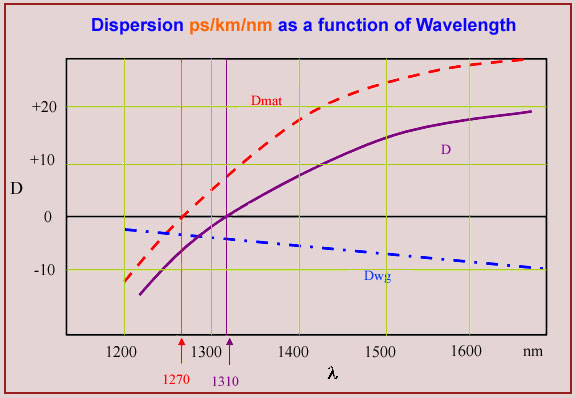
The total chromatic dispersion on a single mode fiber is approximately
The figure shows the plot of material, waveguide and total dispersion.
Note: The material dispersion is zero at 1270nm. However, in a single mode fiber, we always get dispersion which is a combination of material and waveguide dispersion. Therefore
Total dispersion in a single mode fiber is zero at 1310nm.
The dispersion is positive for wavelengths above 1310nm and negative below 1310nm.
Note : The negative dispersion does not mean pulse compression. Due to dispersion the pulse always broadens and the broadening is
Where L is the length of the fiber and is the spectral width of the source.