After measurement of characteristics of individual components of an optical link, finally one has to measure the over all system performance. The system performance would include, distortion of pulses due to system rise time, SNR, clock jitter, etc.
The test which is conducted for this purpose is called the Eye Pattern test.
The data received from the system is displayed on an oscilloscope with data folded over one or two bits. Since the data is random, the display shows all transitions between the two binary states giving details of the bit distortion.
A typical display is shown in following Fig.
The pattern appears like a human eye and therefore is called the eye pattern.
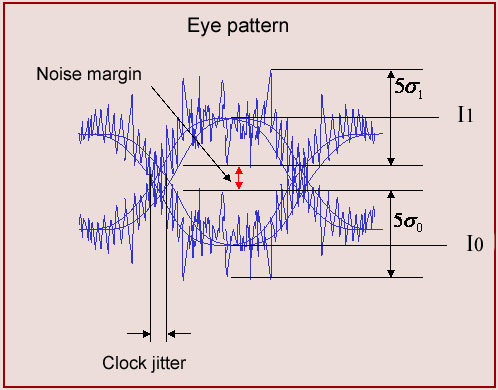
The eye diagram gives the mean levels corresponding to the bit-0 and bit-1. Assuming that the noise is Gaussian, the peak to peak amplitude of noise is approximately . From the diagram therefore we can measure and subsequently the parameter Q.
The eye diagram clearly shows the noise margin in the data and it also shows the timing jitter.
As the SNR of the data reduces, the eye closes vertically, whereas as the clock jitter increases, the eye closes horizontally.
The system parameters are fine tuned to obtain the maximum opening of the eye.
Since the eye diagram can give the value of Q, it can be used for estimating the BER without really running the system for long time.