Raman Spectroscopy:
Raman spectra are also used to study the defects in oxides and to study the effect of defects on the spin correlations. For instance, Figure 39.05 shows the typical Raman spectra for NiO system with different size.
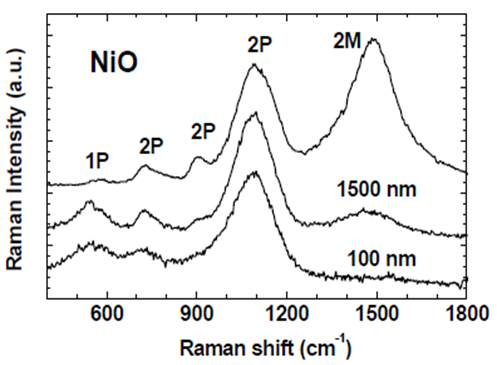
Figure 39.05: Raman spectra of NiO single-crystal (upper curve) and nanopowders having the grain sizes of about 1500 nm and 100 nm. Peaks due to one-phonon (1P), two-phonon (2P) and two- magnon (2M) scattering are indicated [2].
1. The first four bands have vibrational origin → one-phonon (1P) TO/LO, two-phonon (2P) 2TO, TO+LO and 2LO modes. The last band is due to a two- magnon (2M) scattering due to antiferromagnetic correlation.
2. The disorder-induced 1P band at 570 cm-1 has small intensity for single-crystal, but pronounced in powders due to defects or surface effect, but the three 2P bands appear to be more broadened.
3. The phonon related part of the Raman spectra (1P and 2P bands) in nanosized NiO powders is rather similar to that in the single-crystal.
4. The 2M band experiences a dramatic decrease of intensity in nanopowders becoming undetectable for 100 nm crystallites size at room temperature.
Ref.[2]. Ulmane et al, J. Phys. Conf. Series 93 (2007) 012039.
Quiz 39:
(Q39.1) What is Raman effect?
(Q39.2) What are called as Stokes and Anti-stokes?
(Q39.3) Can we study Raman effect with the source other than Laser?
(Q39.4) How do we understand the vibrational and defect mechanisms from Raman spectra?
(Q39.5) What are called as Longitudinal and transverse optical modes?