Raman Spectroscopy:
Figure 39.03 depicts the typical Raman spectrum of methane. Each peak denotes a different vibration. The highest peak implies the strongest vibration. The smallest peak, the last one, shows the weakest of all the vibrations. In short, each vibration implies a different movement: these different movements imply different structures.
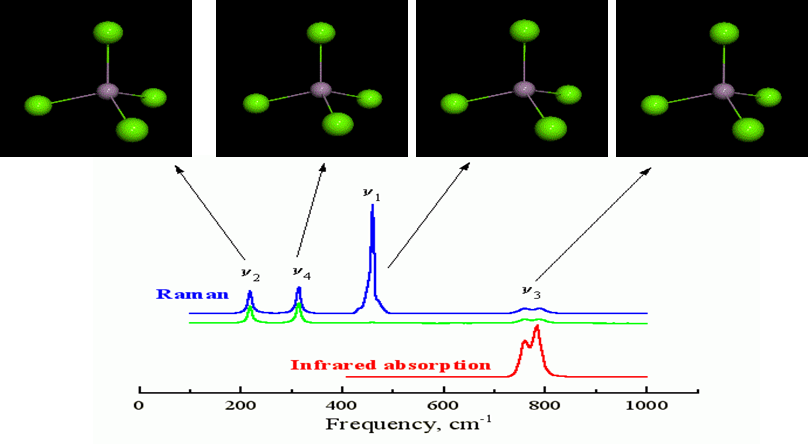
Figure 39.03: Schematic representation various modes of Methane and corresponding Raman spectrum.