Differential thermal analysis:
• The typical DTA curves for various samples
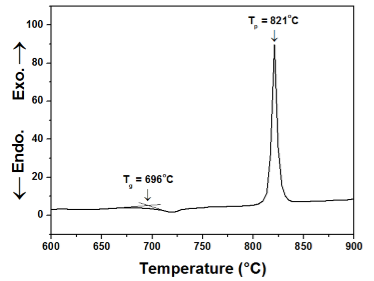
Figure 21.05: DTA curve of Eu3+ doped precursor Li2O-Ta2O5-SiO2-Al2O3 (LTSA) powdered glass [1].
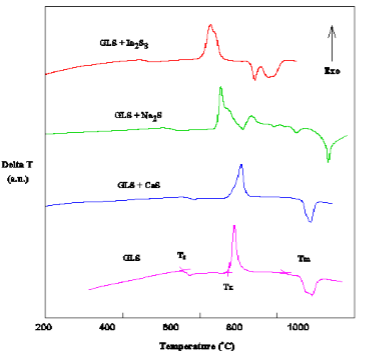
Figure 21.06: DTA plots showing effect of adding a third sulfide in Gallium Lanthanum Sulfide (GLS) on the thermal properties [2].
Ref.[1]. M. Lallart, Ferroelectrics - Material Aspects, Intech, 2011, Chapter 19.
Ref.[2]. J. Wang et al, Optoelectronic research center, The university of Southamption, SO17 1BJ, England.