Differential thermal analysis:
• Evaluation and interpretation of DTA curves
Let us assume that the samples of different masses are heated at different heating rates. Figure 21.04 below shows the possible curves obtainable using DTA thermal analysis.
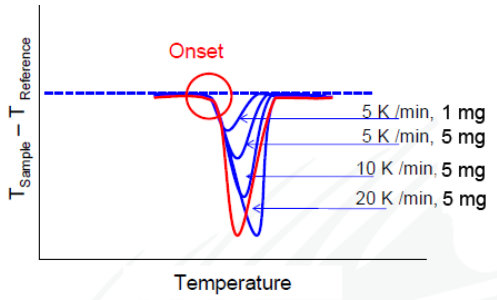
Figure 21.04: Schematic of DTA curves obtained at different heating rates and different masses.
• The peak temperature affected by heating rate and sample mass, i.e., with increasing heating rate, the peak position shifts to higher temperature. However, the onset of peak is not affected by any margin.
• The typical data obtainable from DTA peak evaluation are
| • Onset | - melting |
| • End set | |
| • Integral | - enthalpy ΔH |
| • Peak temperature | - melting |
| • Peak height | |
| • Peak width |