Differential thermal analysis:
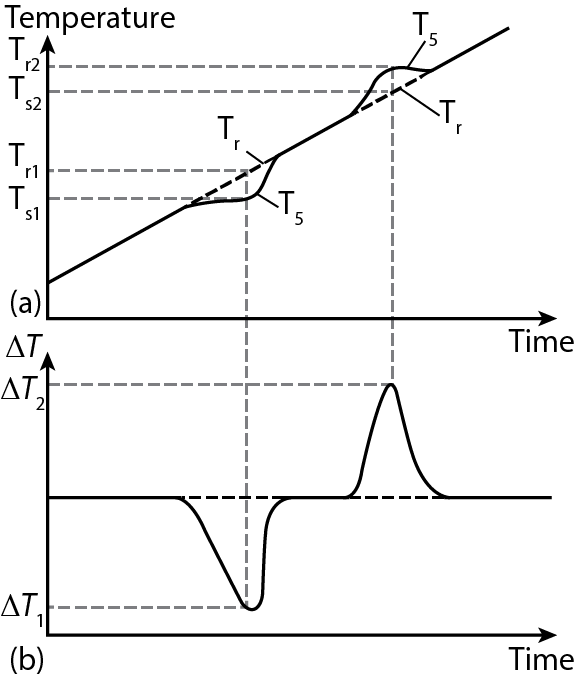
Figure 21.02: Schematic drawing demonstrating the working principles of DTA.
• The temperature measured as a function of time using the separate thermocouples for sample, reference and differential thermocouple are shown in Figure 21.02(a) and (b), respectively.
• When heating of the furnace begins, the heating of sample and reference also begins, but with a slight delay depending on their respective heat capacity. However, both are heated up according to the furnace temperature.
• The difference in temperature changes until a static state is approached after the beginning of the heating. The signal at the static state is known as base line.