TEM: Composition Analysis
Energy dispersive Spectroscopy (or) Energy Dispersive X-ray Analysis:
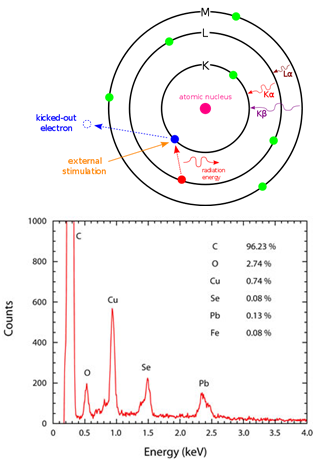
Figure 15.10: Schematic of X-ray generation and the plot of intensity versus X-ray energy to quantify the content. EDS data for the PbSe -MWNT sample. Copper and iron are from the formvar TEM grid and residual nanotube growth catalyst respectively [6].
• When the electron interacts with the specimen, the X-ray characteristics of atoms in the irradiated area are emitted, as shown in Figure 15.10.
• By analyzing the binding energies, the nature of atom or element can be identified.
• By counting the numbers of X-rays emitted, the concentration of atoms in the spectrum can be determined.
• This method helps in analyzing the composition of the specimen.
Ref.[6]. http://www.optics.rochester.edu/workgroups/cml/opt307/spr08/chris/.