Preferred Orientation (texture):
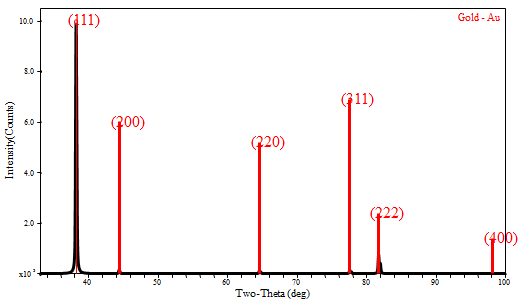
Figure 5.07: Typical XRD pattern of gold sample and selection of particular peak for pole figure analysis.
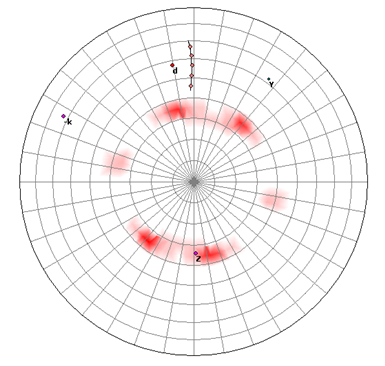
Figure 5.08: Pole figure obtained from XRD analysis.
• A pole figure is drawn as a contour map of X-ray intensity as a function of orientation of sample as shown in Figure 5.08. X-ray intensity is proposed to the number of (hkl) planes in reflecting condition.
• If the crystal grains in the sample have random orientation, the pole figure exhibits a random intensity contour.
Quiz 5:
(Q5.1). Why cann't the Williamson-Hall plot method be used for strain analysis in elastically anisotropic materials?
(Q5.2). Can we extend the modified Williamson-Hall Plot method to all types of strained powders having different crystal structure?