This is similar to y = mx + c. The plot of (Bcosθ/(kλ)) versus sinθ/(kλ) should be a straight line. Hence, the data can be fitted using a straight line, where the slope provides the strain in the sample and the intercept on the y-axis provides the inverse of average crystal size in the materials.
The applicability of the WHP method is described here. Figure 5.02 displays the XRD patterns of the NiO sample prepared through sol-gel technique with different particle size [2] and the analysis of XRD pattern using WHP method. These NiO particles exhibit face centered cubic structure.
1. All the peaks can be analyzed using Gaussian fit and each peak provides one FWHM and peak position.
2. Hence, five peaks in the XRD pattern provide five sets of ((Bcosθ /(kλ) , sinθ/(kλ)).
3. Therefore, the plot of (Bcosθ /(kλ)) versus sinθ/(kλ) reveals a straight line.
The determined value of strain in these particles is very small.
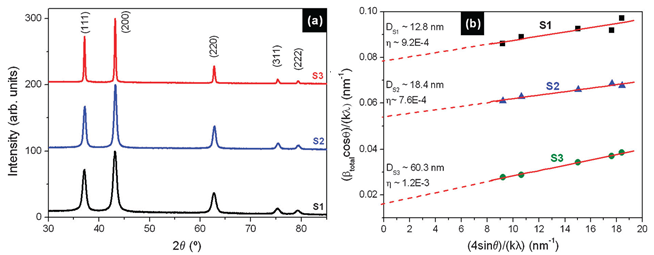
Figure 5.02: (a) Room temperature XRD patterns of NiO particles prepared using sol-gel method. (b) Analysis of XRD pattern using WHP method.
However, the applicability of WHP method for the analysis of XRD pattern fails for the samples experience non-uniform strain. In such case, the plot of (Bcosθ /(kλ)) versus sinθ/(kλ) does not follow straight line. One such case is reported in Figure 5.03 for the Fe-Si powders prepared using mechanical alloying process.
Ref.[2]: Proenca et al, Phys. Chem. Chem. Phys. 13 (2011) 9561