Exercise Problem
Exercise 15.1 A limestone crusher unit has a three-stage gearbox with the total reduction of speed of 1:33.5. The gearbox is driven by a 300 kW electric motor with the input speed of 1493 rpm. The number of teeth of various stages of the pinion is 31, 21, and 25; and that of gears are 66, 87, and 95. Find the possible gear-mesh frequencies, which might be present in the vibration spectrum measured from the gearbox housing. Find the sampling interval you would like to choose to measure the vibration signal from the gearbox to detect all the gear-mesh frequencies correctly.
Exercise 15.2 Choose a single answer from multiple choice answers
- The plot between the vibration amplitude versus frequency and the phase versus frequency is called
(A)Campbell diagram (B) Nyquist plot (C) Bode plot (D) water-fall diagram
Appendix: 15.A Discrete Wavelet Transform
Wavelets provide a time-scale information of a signal, enabling the extraction of features that vary in time. This property makes wavelets an ideal tool for analyzing signals of a transient or non-stationary nature. The continuous wavelet transform (CWT) of f (t) is a time-scale method of signal processing that can be defined as the sum over all time of the signal multiplied by scaled, shifted versions of the wavelet function Ψ(t). Mathematically,
|
(15.A1) |
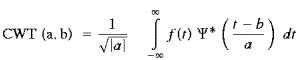
where Ψ(t) denotes the mother wavelet. The parameter a represents the scale index which is a reciprocal of frequency. The parameter b indicates the time shifting (or translation). The discrete wavelet transform (DWT) is derived from the discretization of CWT (a,b) and the most common discretization is dyadic, given by
|
(15.A2) |
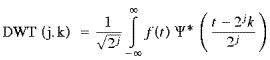
where a and b are replaced by 2j and 2jk. An efficient way to implement this scheme using filters was developed in 1989 by Mallat (1989). The original signal, f (t), passes through two complementary filters and emerges as low frequency [approximations (A’s)] and high frequency [details (D’s)] signals. The decomposition process can be iterated, with successive approximations being decomposed in turn, so that a signal can be broken down into many lower-resolution components