15.8 Faults in Gears
Forces generated at gears are finally transmitted through the bearings to the base or foundation. Thus, vibration measurements taken at the bearings can also indicate the condition of the gearbox. Gears typically generate a complex, broad vibration spectrum beginning with frequencies well below the shaft rotational speeds and extending to several multiples of gear-mesh frequency (i.e., the number of gear teeth times shaft rpm). The amplitude at mesh frequency may vary greatly from gear to gear, depending on the number of teeth, gear ratio, tooth surface finish and load. As a general rule, the amplitude at mesh frequency will be smaller with a (i) larger number of teeth (ii) lower gear ratio (iii) higher quality of tooth finish and (iv) lower load applied to the gear. A narrow-band spectrum analyzer is very useful for this purpose, because the monitoring process involves the detection of discrete frequency components that must be distinguished from frequencies generated through other mechanisms (i.e., rolling element bearings). The characteristic frequency of a particular gear set is the gear mesh frequency (the product of the number of teeth on gear and the shaft rotational frequency), which will be evident in the spectrum relating to any gearbox, in good condition or otherwise. When one gear becomes damaged the gear-mesh frequency component of vibration may increase substantially as compared to the base line vibration measurements, but this is not always the case. Harmonics of gear mesh frequency may also become more apparent. Another frequency, which is often excited by gear defects, is the resonant frequency of geared shaft itself. This frequency can usually be measured by impulse testing. Both the natural frequency of the geared shaft and the gear mesh frequency may have accompanying side bands; sometimes side bands themselves may be the main indicator of a defective gearbox (Figs. 15.16 and 15.15).
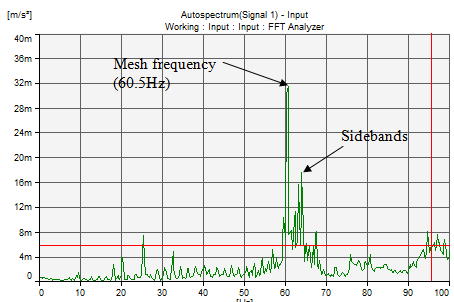
Figure 15.16 The typical spectrum for a healthy pinion with indication of the mesh frequency and its sidebands at no-load condition (shaft speed of 10Hz)
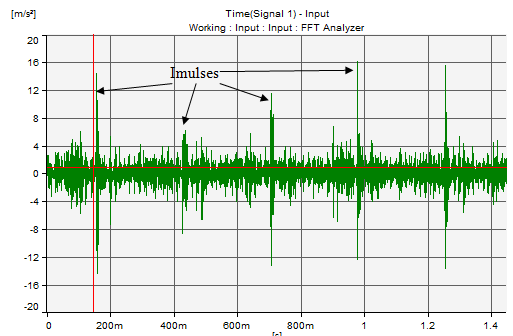
Figure 15.15 The signal in time domain for one chipped toothed pinion with indication of impulse appearing at no-load condition (shaft speed of 10Hz)
Recent trends: Gearboxes play an important role in industrial applications. Typical faults of gears include pitting, chipping, and more seriously, crack. When a gear has a local fault, the vibration signal of the gearbox may contain amplitude and phase modulations that are periodic with the rotation frequency of the gear. The modulation of the meshing frequency, as a result of faulty teeth, generates sidebands, which are frequency components equally spaced around a centre frequency. The centre frequency called the carrier frequency may be the gear mesh frequency, multiples of bearing ball pass frequency, resonant frequency of a machine component/structure, or the resonant frequency of an accelerometer. Sidebands are either the shaft rotational speed or one of its multiples. It is well known that the most important components in gear vibration spectra are the tooth-meshing frequency and their harmonics, together with sidebands. Amplitude modulations are present when a gear meshes an eccentric gear or a gear riding on a bent or misaligned shaft. If there is a local gear fault, the gear angular velocity could change as a function of the rotation. As a result of the speed variation, frequency modulations occur. In many cases, both amplitude and frequency modulations are present. The increase in the number and the amplitude of such sidebands often indicates faulty conditions (Dalpiaz, 2000). Since modulating frequencies are caused by certain faults of machine components including gear, bearing, and shaft, the detection of the modulating signal is very useful to detect gearbox fault. In the early stage of a fault, fault symptoms are not obvious. Due to unsteady shaft/gear rotating speed, lubrication situation, tooth stiffness variations, and other reasons, the collected vibration signal from a gearbox is usually non-stationary. Sideband distance may vary with time. As a result, the spectral composition of the collected vibration signal often changes with time. Fourier analysis is unable to reveal such characteristics (Yesilurt, 2000). Other approaches are needed to identify early fault features from non-stationary signals.
The process of restoring the modulating signal that is mixed with a carrier signal is called demodulation. The detection of the modulating signal is traditionally realised through identification of sidebands in the frequency domain. However, when a signal acquired is transient in nature, spectral analysis is inherently unsuitable for detection of sidebands (Ma and Li, 1996). Hilbert transform (HT) is shown to be useful for demodulation (Feldman, 1997). However, it is unable to show frequencies clear enough for visual inspection. Therefore, by itself, it cannot reveal early fault signatures buried in non-stationary signals. Time–frequency analysis offers an alternative method to signal analysis by presenting information in the time–frequency domain simultaneously. The short-time Fourier transform is probably the most widely used time-frequency representation. However, its resolution is often unsatisfactory because of poorly matched windows in signal analysis (Jones and Parks, 1992). Though Wigner–Ville distribution, another time–frequency method, is also used in fault detection (McFadden and Wang, 1992), the oscillating interference between the signal components often exists when applied to a multi-component signal (Yesilurt, 2000). The Choi–Williams distribution provides better resolution than the smoothed Wigner–Ville distribution; however, it is still insensitive to the time-scale of signal components (Jones and Parks, 1992). The smoothed instantaneous power spectrum method, which combines the advantages of the spectrogram and the instantaneous power spectrum, gives clearer time–frequency representation of signal (Yesilurt, 2000). However, weak signals may be lost in the process. (Fan and Zuo, 2006) proposed a fault detection method that combines Hilbert transform and wavelet packet transform.