Similarly,
the cold streams can be combined.
The cold composite curve will consists of
- Stream3 from 40°C to 100°C with heat capacity 2.8 kW/K,
- Stream (3+4) between temperature 100°C to 150°C, a combined stream of thermal capacity rate (2.8+5.12) = 7.92 kW/K
- Stream4 between temperatures 70°C to 50°C, stream 1 with heat capacity rate 1.98 kW/K.
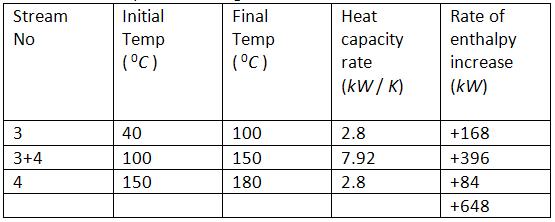
To plot the composite cooling curve the calculations can be estimated as shown in Table 1.11.
Table 1.11 Composite Cooling Curve
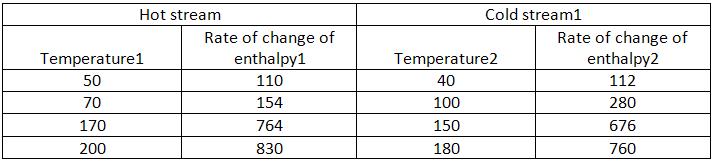
The two composite streams are then plotted on a temperature heat load graph. The temperature and rate of change of enthalpy for cold stream and hot stream are estimated in Table 1.12.
At temp 50°C the rate of change of enthalpy = Heat
capacity rate × Δt
= 2.2 × 50
= 110 Kw
Similarly, at temp 40°C the rate of change of enthalpy
= Heat capacity rate × Δt
=
2.8 × 40
= 112 Kw
Similar calculations are done for the selected data.
Table 1.12 Estimation of hot and cold steam
The two composite streams are then plotted on a temperature heat load graph as shown in Fig. 1.34.
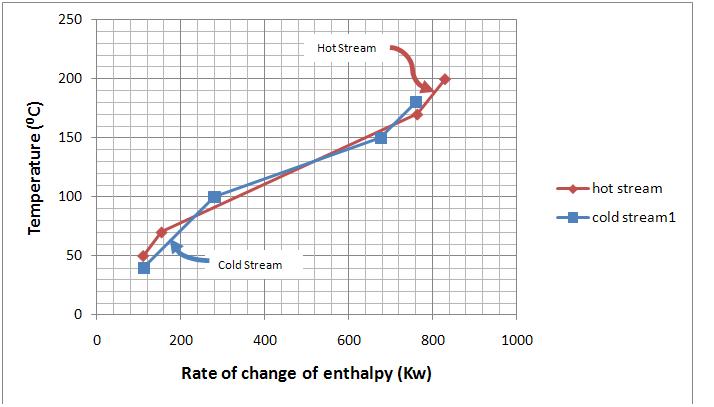
Fig 1.34 Temperature verses rate of change enthalpy change for composite hot and cold streams