1 Frequency Domain Analysis
When a sinusoidal input is given to a stable LTI system it produces a sinusoidal output of same frequency but with different magnitude and phase.
The variation of output magnitude and phase with input frequency is known as frequency response of the system.
Frequency domain analysis provides a good design in presence of uncertainty in plant model. Experimental results can be used to construct frequency response even if the plant model is unknown.
Analysis of digital control systems in frequency domain depends on the extension of the existing techniques in continuous time case.
Two most popular graphical representations in frequency domain are Nyquist plot and Bode diagram .
1.1 Nyquist plot
The Nyquist plot of a transfer function, usually the loop transfer function ![]() , is a mapping of Nyquist contour in z-plane onto
, is a mapping of Nyquist contour in z-plane onto ![]() plane which is in polar coordinates. Thus it is sometimes known as polar plot.
plane which is in polar coordinates. Thus it is sometimes known as polar plot.
Absolute and relative stabilities can be determined from the Nyquist plot using Nyquist stability criterion.
Given the loop transfer function ![]() of a digital control system, the polar plot of
of a digital control system, the polar plot of ![]() is obtained by setting z = e jωT and varying ω from 0 to ∞.
is obtained by setting z = e jωT and varying ω from 0 to ∞.
Nyquist stability criterion: The closed loop transfer function of single input single output digital control system is described by 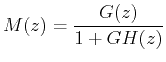
Characteristic equation ![]()
The stability of the system depends on the roots of the characteristic equation or poles of the system. All the roots of the characteristic equation must lie inside the unit circle for the system to be stable.
Before discussing Nyquist stability criterion for the digital system, following steps are necessary.
- 1. Defining the Nyquist path in the z -plane that encloses the exterior of the unit circle. Here the region to the left of a closed path is considered to be enclosed by that path when the direction of the path is taken anticlockwise.
2. Mapping the Nyquist path in z -plane onto the ![]() plane which results in Nyquist plot of
plane which results in Nyquist plot of ![]() .
.
3. Stability of the closed loop system is investigated by studying the behavior of Nyquist plot with respect to the critical point ![]() in the
in the ![]() plane.
plane.