The groundwater may be contaminated from various sources. Some of the sources are natural and some of them are manmade. Some of the sources of groundwater contamination are:
- • Septic tanks and cesspools
• Injection wells of hazardous wastes, agricultural and urban runoff, municipal sewage, etc
• Landfill leaching
• Mine wastes
• Animal burials
• Radioactive waste disposal sites
• Pesticide and fertilizer applied to crop field
• Saltwater intrusion in coastal aquifer
• Leaching of natural minerals like fluoride, arsenic, iron, etc.
The solute present in groundwater aquifer can move from one place to another place mainly by the processes of diffusion and advection. The mixing of solute also takes place by the process of mechanical dispersion. The transportation of pollutants from one place to another place will contaminate the aquifer and the aquifer may become unusable for domestic, industrial, irrigational, etc. uses. As such modeling of the transport processes is essential to mitigate the aquifer contamination problem. In the following sections, we will discuss the processes of mixing of solute in groundwater and also their mathematical modeling.
Molecular diffusion
Solute in water moves from the areas of higher concentration to the areas of lower concentration. This phenomenon is known as molecular diffusion. This phenomenon can be observed by a simple experiment as shown in Fig. 31.1. The blue color of the Fig. 31.1 (a) shows the solute mixed water and the white color shows the pure water. These two fluids are separated by an impermeable thin separator. At this stage, the distance verses concentration curve will be a step curve. If we remove the impermeable barrier instantaneously, these two fluids will mix each other by the process of diffusion. Fig. 31.1(b) shows the mixing of fluid after some time. The distance verses relative concentration curve will now take a shape of S (Fig. 31.1d). The diffusion phenomenon can also be observed by putting a drop of ink in a glass of water. The ink will mix with the water as time elapses .
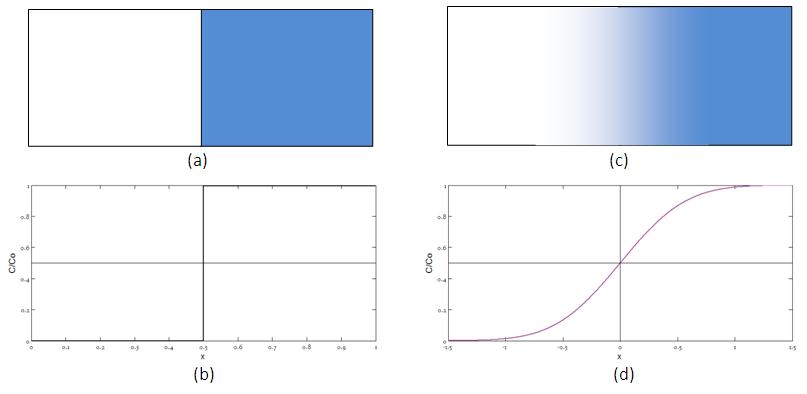 Fig. 31.1 The diffusion process, (a) At initial state, (b) The distance verses relative concentration plot at initial state, (c) At time " t " from the start of the diffusion process, and (d) The distance verses relative concentration plot at time " t "