The cash flow diagram of Alternative-2 is shown in Fig. 2.4.
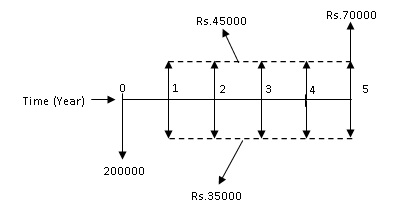
Fig. 2.4 Cash flow diagram of Alternative-2
Now the equivalent present worth of Alternative-2 i.e. PW2 (in Rs.) is calculated as follows;
PW2= - 2,00,000 - 35,000 (P/A, i, n) + 45,000 (P/A, i, n) + 70,000 (P/F, i, n)
PW2 = - 2,00,000 - 35,000 (P/A, 10%, 5) + 45,000 (P/A, 10%, 5) + 70,000 (P/F, 10%, 5)
PW2 = - 2,00,000 + (45,000 – 35,000) (P/A, 10%, 5) + 70,000 (P/F, 10%, 5)
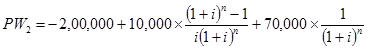
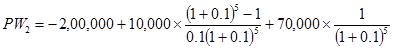
PW2 = - 2,00,000 + 10,000 (P/A, 10%, 5) + 70,000 (P/F, 10%, 5)
![]()
PW2 = - 2,00,000 + 37,908 + 43,463
PW2= - Rs.1,18,629
Comparing the equivalent present worth of the both the alternatives, it is observed that Alternative-1 will be selected as it shows lower cost compared to Alternative-2. The annual revenue to be generated by the alternatives made the difference as compared to the outcome obtained in Example-1.
When there are more than two alternatives for the selection of the best economical alternative by present worth method, the same procedure as mentioned earlier for the case of two alternatives is followed and illustrated in the next example.
Example -3
A construction contractor has three options to purchase a dump truck for transportation and dumping of soil at a construction site. All the alternatives have the same useful life. The cash flow details of all the alternatives are provided as follows;
Option-1: Initial purchase price = Rs.25,00,000, Annual operating cost Rs.45,000 at the end of 1st year and increasing by Rs.3000 in the subsequent years till the end of useful life, Annual income = Rs.1,20,000, Salvage value = Rs.5,50,000, Useful life = 10 years.
Option-2: Initial purchase price = Rs.30,00,000, Annual operating cost = Rs.30,000, Annual income Rs.1,50,000 for first three years and increasing by Rs.5000 in the subsequent years till the end of useful life, Salvage value = Rs.8,00,000, Useful life = 10 years.
Option-3: Initial purchase price = Rs.27,00,000, Annual operating cost Rs.35,000 for first 5 years and increasing by Rs.2000 in the successive years till the end of useful life, Annual income = Rs.1,40,000, Expected salvage value = Rs.6,50,000, Useful life = 10 years.
Using present worth method, find out which alternative should be selected, if the rate of interest is 8% per year.
Solution:
The cash flow diagram of Option-1 is shown in Fig. 2.5.
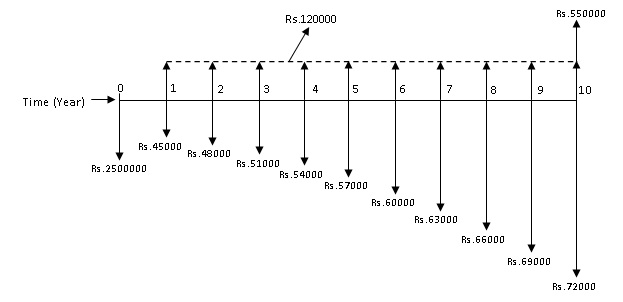
Fig. 2.5 Cash flow diagram of Option-1
For Option-1, the annual operating cost is in the form of a positive uniform gradient series with gradient starting from end of year ‘2’. The operating cost at the end of different years can be split into the uniform base amount of Rs.45,000 and the gradient amount in multiples of Rs.3000 as shown in Fig. 2.6.
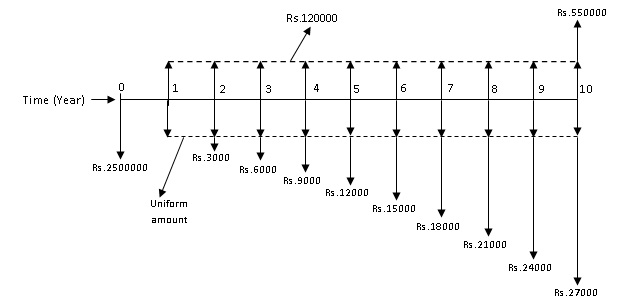
Fig. 2.6 Cash flow diagram of Option-1 with annual operating cost split into uniform base amount and gradient amount