Comparison by present worth method:-
Now some examples showing the use of present worth method for comparison of mutually exclusive alternatives are presented. First the comparison of equal life span mutually exclusive alternatives by present worth method will be illustrated followed by comparison of different life span alternatives. The following examples are formulated only to demonstrate the use of different methods for comparison of alternatives. The values of different cost and incomes mentioned in the examples are not the actual ones pertaining to a particular item. In addition it may also be noted here that the cash flow diagrams have been drawn not to the scale. These are merely graphical representations.
Example -1
There are two alternatives for purchasing a concrete mixer. Both the alternatives have same useful life. The cash flow details of alternatives are as follows;
Alternative-1: Initial purchase cost = Rs.3,00,000, Annual operating and maintenance cost = Rs.20,000, Expected salvage value = Rs.1,25,000, Useful life = 5 years.
Alternative-2: Initial purchase cost = Rs.2,00,000, Annual operating and maintenance cost = Rs.35,000, Expected salvage value = Rs.70,000, Useful life = 5 years.
Using present worth method, find out which alternative should be selected, if the rate of interest is 10% per year.
Solution:
Since both alternatives have the same life span i.e. 5years, the present worth of the alternatives will be compared over a period of 5 years. The cash flow diagram of Alternative-1 is shown in Fig. 2.1.
As already mentioned Module-1, the cash outflows i.e. costs or expenditures are represented by vertically downward arrows whereas the cash inflows i.e. revenue or income are represented by vertically upward arrows. The same convention is adopted here.
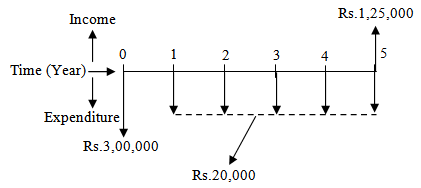
Fig. 2.1 Cash flow diagram of Alternative-1
The equivalent present worth of Alternative-1 i.e. PW1 is calculated as follows;
The initial cost, P = Rs.3,00,000 (cash outflow),
Annual operating and maintenance cost, A = Rs.20,000 (cash outflow),
Salvage value, F = Rs.1,25,000 (cash inflow).
PW1 = - 3,00,000 - 20,000(P/A, i, n) + 1,25,000(P/F, i, n)
PW1 = - 3,00,000 - 20,000(P/A, 10%, 5) + 1,25,000(P/F, 10%, 5)
Now putting the mathematical expressions of different compound interest factors (as mentioned in Module-1) in the above expression for PW1 (in Rs.) results in the following;
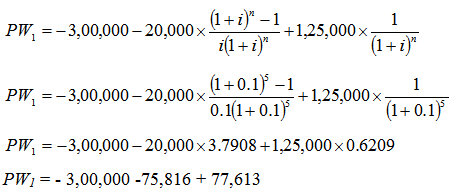
PW1 = - 3,00,000 -75,816 + 77,613
PW1= - Rs.2,98,203
The cash flow diagram of Alternative-2 is shown in Fig. 2.2.
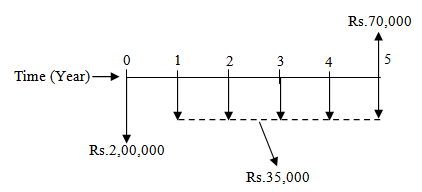
Fig. 2.2 Cash flow diagram of Alternative-2