| |
| | |
|
Green splitting or apportioning of green time is the proportioning of effective
green time in each of the signal phase.
The green splitting is given by,
![$\displaystyle g_i = \left[\frac{V_{c_i}}{\sum_{i=1}^N{V_{c_i}}}\right]\times t_g$](img1.png) |
(1) |
where  is the critical lane volume and is the critical lane volume and  is the total effective green
time available in a cycle.
This will be cycle time minus the total lost time for all the phases.
Therefore, is the total effective green
time available in a cycle.
This will be cycle time minus the total lost time for all the phases.
Therefore,
 |
(2) |
where  is the cycle time in seconds, is the cycle time in seconds,  is the number of phases, and is the number of phases, and  is the lost time per phase.
If lost time is different for different phases, then effective green time can be computed
as follows:
is the lost time per phase.
If lost time is different for different phases, then effective green time can be computed
as follows:
 |
(3) |
where  is the lost time for phase is the lost time for phase  , ,  is the number of phases and
is the cycle time in seconds.
Actual green time can be now found out as, is the number of phases and
is the cycle time in seconds.
Actual green time can be now found out as,
 |
(4) |
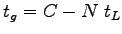
where  is the actual green time, is the actual green time,  is the effective green time
available, is the effective green time
available,  is the amber time, and is the amber time, and  is the lost time for phase .
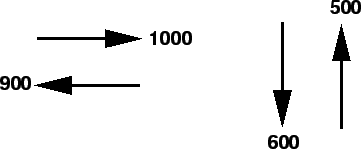
The phase diagram with flow values of an intersection with two phases is shown
in figure 1. is the lost time for phase .
The phase diagram with flow values of an intersection with two phases is shown
in figure 1.
Figure 1:
Phase diagram for an intersection
 |
The lost time and yellow time for the first phase is 2.5 and 3 seconds
respectively. For the second phase the lost time and yellow time are 3.5 and 4
seconds respectively.
If the cycle time is 120 seconds, find the green time allocated for the two
phases.
- Critical lane volume for the first phase,
 = 1000 vph. = 1000 vph.
- Critical lane volume for the second phase,
 = 600 vph. = 600 vph.
- Total critical lane volumes,
 = 1000+600 =
1600 vph. = 1000+600 =
1600 vph.
- Effective green time can be found out from equation 2
as
 =120-(2.5-3.5)= 114 seconds. =120-(2.5-3.5)= 114 seconds.
- Green time for the first phase,
 can be found out from
equation 1
as can be found out from
equation 1
as
 = 71.25 seconds. = 71.25 seconds.
- Green time for the second phase,
 can be found out from
equation 1
as can be found out from
equation 1
as
 = 42.75
seconds. = 42.75
seconds.
- Actual green time can be found out from equation 4.
Thus actual green time for the first phase,
 = 71.25-3+2.5 = 71
seconds (rounded). = 71.25-3+2.5 = 71
seconds (rounded).
- Actual green time for the second phase,
 = 42.75-4+3.5 = 42
seconds (rounded). = 42.75-4+3.5 = 42
seconds (rounded).
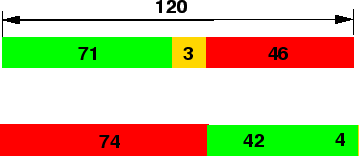
- The phase diagram is as shown in figure 2.
Figure 2:
Timing diagram
 |
|
|
| | |
|
|
|