|
The cycle length or cycle time is the time taken for complete indication of
signals in a cycle.
Fixing the cycle length is one of the crucial steps involved in signal design.
If  is the start-up lost time for a phase is the start-up lost time for a phase  , then the total
start-up lost time per cycle, , then the total
start-up lost time per cycle,
 , where , where  is the number
of phases.
If start-up lost time is same for all phases, then the total start-up lost time
is is the number
of phases.
If start-up lost time is same for all phases, then the total start-up lost time
is  .
If .
If  is the cycle length in seconds, then the number of cycles per hour = is the cycle length in seconds, then the number of cycles per hour =
 .
The total lost time per hour is the number of cycles per hour times the lost
time per cycle and is = .
The total lost time per hour is the number of cycles per hour times the lost
time per cycle and is =
 .
Substituting as , total lost time per hour can be written as = .
Substituting as , total lost time per hour can be written as =
 .
The total effective green time .
The total effective green time  available for the movement in a hour will
be one hour minus the total lost time in an hour.
Therefore, available for the movement in a hour will
be one hour minus the total lost time in an hour.
Therefore,
Let the total number of critical lane volume that can be accommodated per hour
is given by  , then , then
 .
Substituting for from equation 1 and .
Substituting for from equation 1 and  from
equation from
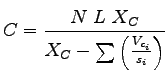
equation ![[*]](file:/usr/local/share/lib/latex2html/icons/crossref.png) in the expression for the
the maximum sum of critical lane volumes that can be
accommodated within the hour and by rewriting, the expression for can be
obtained as follows: in the expression for the
the maximum sum of critical lane volumes that can be
accommodated within the hour and by rewriting, the expression for can be
obtained as follows:
The above equation is based on the assumption that there will be uniform flow
of traffic in an hour.
To account for the variation of volume in an hour, a factor called peak hour
factor, (PHF) which is the ratio of hourly volume to the maximum flow rate, is
introduced.
Another ratio called v/c ratio indicating the quality of service is also
included in the equation.
Incorporating these two factors in the equation for cycle length, the final
expression will be,
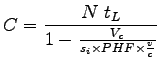 |
(1) |
Highway capacity manual (HCM) has given an equation for determining the cycle
length which is a slight modification of the above equation.
Accordingly, cycle time is given by,
 |
(2) |
where is the number of phases,  is the lost time per phase, is the lost time per phase,
 is the ratio of critical volume to saturation flow for phase , is the ratio of critical volume to saturation flow for phase ,
 is the quality factor called critical is the quality factor called critical
 ratio where ratio where  is the
volume and is the
volume and  is the capacity.
The traffic flow in an intersection is shown in the figure 1. is the capacity.
The traffic flow in an intersection is shown in the figure 1.
Figure 1:
Traffic flow in the intersection
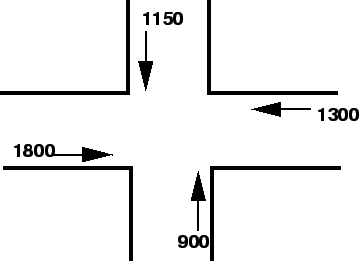 |
Given start-up lost time is 3 seconds, saturation head way is 2.3 seconds,
compute the cycle length for that intersection.
Assume a two-phase signal.
- If we assign two phases as shown below figure 2, then the
critical volume for the first phase which is the maximum of the flows in that
phase = 1150 vph.
Figure 2:
One way of providing phases
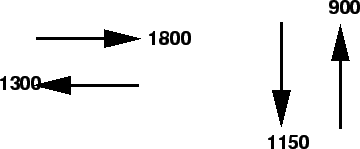 |
Similarly critical volume for the second phase = 1800 vph.
Therefore, total critical volume for the two signal phases = 1150+1800 = 2950
vph.
- Saturation flow rate for the intersection can be found out from the
equation as
 = 1565.2 vph.
This means, that the intersection can handle only 1565.2 vph. However, the
critical volume is 2950 vph .
Hence the critical lane volume should be reduced and one simple option is to
split the major traffic into two lanes.
So the resulting phase plan is as shown in figure 3. = 1565.2 vph.
This means, that the intersection can handle only 1565.2 vph. However, the
critical volume is 2950 vph .
Hence the critical lane volume should be reduced and one simple option is to
split the major traffic into two lanes.
So the resulting phase plan is as shown in figure 3.
Figure 3:
second way of providing phases
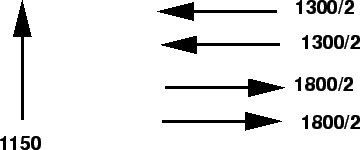 |
- Here we are dividing the lanes in East-West direction into two, the
critical volume in the first phase is 1150 vph and in the second phase it is
900 vph.
The total critical volume for the signal phases is 2050 vph which is again
greater than the saturation flow rate and hence we have to again reduce the
critical lane volumes.
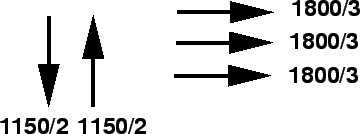
- Assigning three lanes in East-West direction, as shown in
figure 4, the critical volume in the first phase is 575 vph and
that of the second phase is 600 vph, so that the total critical lane volume =
575+600 = 1175 vph which is lesser than 1565.2 vph.
Figure 4:
Third way of providing phases
 |
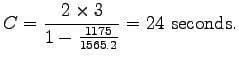
- Now the cycle time for the signal phases can be computed from
equation 1 as:
|
|
![$\displaystyle 3600\left[1-\frac{N~t_L}{C}\right]$](img14.png)
![$\displaystyle \frac{3600}{h}\left[1-\frac{N~t_L}{C}\right],$](img20.png)
![$\displaystyle s_i\left[1-\frac{N~t_L}{C}\right],$](img21.png)