| |
| | |
|
Level of service is defined as:
qualitatively measures both the operating conditions
within a traffic system and how these conditions are perceived by drivers and
passengers.
These operational conditions within a traffic stream are generally described in
terms of service measures as speed and travel time, freedom to maneuver, traffic interruptions, and comfort and convenience.
The three measures of speed, density and flow are interrelated.
If values of two are known, the third can be computed.
Six LOS are defined for each type of facility that has analysis procedures
available.
Letters designate each level, from A to F, with LOS A representing the best
operating conditions and LOS F the worst.
Each level of service represents a range of operating conditions and the
driver's perception of those conditions.
Safety is not included in the measures that establish service levels.
- LOS A describes free-flow operations.
Free-flow speeds prevail.
Vehicles are almost completely unimpeded in their ability to maneuver within the
traffic stream.
The effects of incidents or point breakdowns are easily absorbed at this level.
- LOS B represents reasonably free flow, and free-flow speeds are maintained.
The ability to maneuver within the traffic stream is only slightly restricted,
and the general level of physical and psychological comfort provided to drivers
is still high.
The effects of minor incidents and point breakdowns are still easily absorbed.
- LOS C provides for flow with speeds at or near the FFS of the freeway.
Freedom to maneuver within the traffic stream is noticeably restricted, and lane changes require more care and vigilance on the part of the driver.
Minor incidents may still be absorbed, but the local deterioration in service
will be substantial.
Queues may be expected to form behind any significant blockage.
- LOS D is the level at which speeds begin to decline slightly with increasing
flows and density begins to increase somewhat more quickly.
Freedom to maneuver within the traffic stream is more noticeably limited, and
the driver experiences reduced physical and psychological comfort levels.
Even minor incidents can be expected to create queuing, because the traffic
stream has little space to absorb disruptions.
- LOS E describes operation at capacity.
Operations at this level are volatile, because there are virtually no usable
gaps in the traffic stream.
Vehicles are closely spaced leaving little room to maneuver within the traffic
stream at speeds that still exceed 80 km/h.
Any disruption of the traffic stream, such as vehicles entering from a ramp or a
vehicle changing lanes, can establish a disruption wave that propagates
throughout the upstream traffic flow.
At capacity, the traffic stream has no ability to dissipate even the most minor
disruption, and any incident can be expected to produce a serious breakdown with
extensive queuing.
Maneuverability within the traffic stream is extremely limited, and the level of physical and psychological comfort afforded the driver is poor.
- LOS F describes breakdowns in vehicular flow.
Such conditions generally exist within queues forming behind breakdown points.
Breakdowns occur for a number of reasons:
- Traffic incidents can cause a temporary reduction in the capacity of a
short segment, so that the number of vehicles arriving at the point is greater
than the number of vehicles that can move through it.
- Points of recurring congestion, such as merge or weaving segments and lane
drops, experience very high demand in which the number of vehicles arriving is
greater than the number of vehicles discharged.
In all cases, breakdown occurs when the ratio of existing demand to actual
capacity forecast demand to estimated capacity exceeds 1.00.
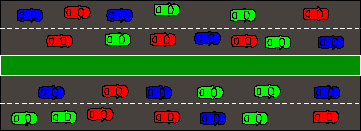
The figures 1-6 given below gives a better idea
of the LOS classification done on the basis of density of the traffic stream.
Figure 1:
LOS A
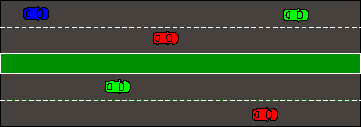 |
Figure 2:
LOS B
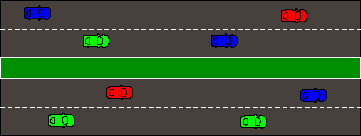 |
Figure 3:
LOS C
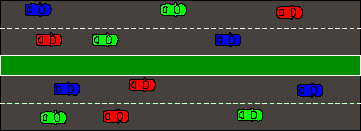 |
Figure 4:
LOS D
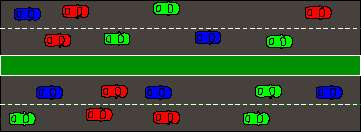 |
Figure 5:
LOS E
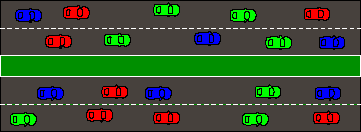 |
Figure 6:
LOS F
 |
|
|
| | |
|
|
|