| |
| | |
|
In a case study, the average travel time from the upstream point to 1st downward
point (point in between upstream and downstream) was found out to be 22.8
seconds and from upstream point to downward point (end point) was found out to
be 32.8 seconds , standard deviation is 5.951 and model time step duration is 10
sec.
Find out the Robertson's model parameters and also the flow at downstream at
different time steps where the upstream flows are as given below.
 .
This problem is similar to the earlier problem.
Only there are 2 downstream points given in this.
For the first downstream point, upstream values of flow given in the problem
will be used, whereas for the .
This problem is similar to the earlier problem.
Only there are 2 downstream points given in this.
For the first downstream point, upstream values of flow given in the problem
will be used, whereas for the  downstream point, the flow from the downstream point, the flow from the
 downstream point is to be used.
Hence at downstream point, flow in the first interval is zero and at
the downstream point is to be used.
Hence at downstream point, flow in the first interval is zero and at
the  downstream value, flow is zero for first 2 intervals.
The calculations have been done in excel and the following shows the results. downstream value, flow is zero for first 2 intervals.
The calculations have been done in excel and the following shows the results.
| Upstream Vol. for (in sec.) |
No. of Vehicles |
| 10 |
20 |
| 20 |
10 |
| 30 |
15 |
| 40 |
18 |
| 50 |
14 |
| 60 |
12 |
| |
0 |
| |
0 |
| |
0 |
| |
0 |
| |
89 |
| Smoothing Factor F |
0.783 |
| Lag Time(For In Between Point) |
20 sec |
| Lag Time(For End Point) |
30 sec |
| Downstream Volume |
|
Downstream Volume |
|
| At in between Point |
|
At End Point |
|
|---|
| (in seconds) |
|
(in seconds) |
|
| 10 |
0 |
10 |
0.00 |
| 20 |
15.66 |
20 |
0.00 |
| 30 |
11.23 |
30 |
12.26 |
| 40 |
14.18 |
40 |
11.45 |
| 50 |
17.17 |
50 |
13.59 |
| 60 |
14.69 |
60 |
16.39 |
| 70 |
12.58 |
70 |
15.06 |
| 80 |
2.73 |
80 |
13.12 |
| 90 |
0.59 |
90 |
4.99 |
| 100 |
0.13 |
100 |
1.55 |
| |
0.00 |
110 |
0.44 |
| |
88.96 |
120 |
0.09 |
| |
|
|
88.84 |
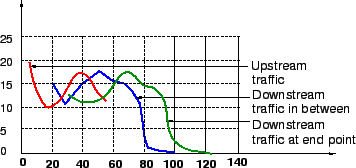
Four graphs are plotted below.
The first graph shows the upstream profile, the second shows the downstream profile at in between point, the third shows the downstream profile at the end point.
The last graph shows the comparison of all the three.
|
|
| | |
|
|
|