This method uses two factors: namely, velocity of vehicle type and its
projected rectangular area to calculate the PCU value.
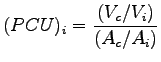 |
(1) |
where  and and  are mean speeds of car and vehicle of type i respectively
and are mean speeds of car and vehicle of type i respectively
and  and and  are their respective projected rectangular area length *
width on the road. are their respective projected rectangular area length *
width on the road.
Table 1:
Table for calculation using Chandra's method
| Category |
Vehicle |
Dimension |
Projected Area |
| Car |
Car, Jeep, Van |
3.72 x 1.44 |
5.39 |
| Bus |
Bus |
10.10 x 2.43 |
24.74 |
| Truck |
Truck |
7.50 x 2.35 |
17.62 |
| LCV |
Mini bus/trucks |
6.10 x 2.10 |
12.81 |
| M-Truck |
Multi-axle truck |
2.35 x 12.0 |
28.60 |
| Bikes |
Scooter, Motorbike |
1.87 x 0.64 |
1.20 |
| Cycle |
Pedal Cycle |
1.90 x 0.45 |
0.85 |
| Autos |
Auto, Tempo |
3.20 x 1.40 |
4.48 |
|
The table given shows the data obtained in spot speed study for various vehicle
types.
Find the PCU value for each vehicle type using the Chandra's Method.
Table 2:
Table of spot speed study for various vehicle types
| No |
Car |
3 wheeler |
2 wheeler |
LCV |
HCV |
| 1 |
11.32 |
8.67 |
6.67 |
6.0 |
7.4 |
| 2 |
6.74 |
7.25 |
8.27 |
6.88 |
6.09 |
| 3 |
11.11 |
9.68 |
7.75 |
7.5 |
5.88 |
| 4 |
6.67 |
6.98 |
6.12 |
8.57 |
6.38 |
| 5 |
8.11 |
8.77 |
9.52 |
9.67 |
5.66 |
| 6 |
7.41 |
8.77 |
11.9 |
8.57 |
5.66 |
| 7 |
8.11 |
9.52 |
6.97 |
5.7 |
5.55 |
| 8 |
9.93 |
9.40 |
6.97 |
4.68 |
6.12 |
|
Step 1
We have to find the space mean speed for each vehicle type using the formula:
Where n is the no. of observations and  is the spot speeds. is the spot speeds.
Step 2
Find the PCU values using Chandra's Method. Use the table having the areas of
various vehicle types given above.
Table 3:
PCU values using Chandra's Method
| No |
Car |
3 wheeler |
2 wheeler |
LCV |
HCV |
| 1 |
11.32 |
8.67 |
6.67 |
6.0 |
7.4 |
| 2 |
6.74 |
7.25 |
8.27 |
6.88 |
6.09 |
| 3 |
11.11 |
9.68 |
7.75 |
7.5 |
5.88 |
| 4 |
6.67 |
6.98 |
6.12 |
8.57 |
6.38 |
| 5 |
8.11 |
8.77 |
9.52 |
9.67 |
5.66 |
| 6 |
7.41 |
8.77 |
11.9 |
8.57 |
5.66 |
| 7 |
8.11 |
9.52 |
6.97 |
5.7 |
5.55 |
| 8 |
9.93 |
9.40 |
6.97 |
4.68 |
6.12 |
 |
8.34 |
8.52 |
7.70 |
6.83 |
6.05 |
|
Then we can use the table given above to find the areas of different vehicle
types to find corresponding PCU values.
Table 4:
Table of PCU values
|
8.34 |
8.52 |
7.70 |
6.83 |
6.05 |
| PCU |
1 |
0.81 |
0.24 |
2.90 |
6.33 |
|
|
