| |
| | |
|
Similar to the flow-density relationship, speed will be maximum, referred to as
the free flow speed, and when the density is maximum, the speed will be zero.
The most simple assumption is that this variation of speed with density is
linear as shown by the solid line in figure 1.
Corresponding to the zero density, vehicles will be flowing with their desire
speed, or free flow speed.
When the density is jam density, the speed of the vehicles becomes zero.
Figure 1:
Speed-density diagram
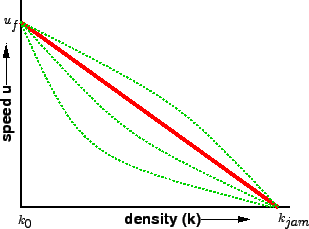 |
It is also possible to have non-linear relationships as shown by the dotted
lines.
These will be discussed later.
|
|
| | |
|
|
|