| |
| | |
|
The relation between flow and density, density and speed, speed and flow, can
be represented with the help of some curves.
They are referred to as the fundamental diagrams of traffic flow.
They will be explained in detail one by one below.
The flow and density varies with time and location.
The relation between the density and the corresponding flow on a given stretch
of road is referred to as one of the fundamental diagram of traffic flow.
Some characteristics of an ideal flow-density relationship is listed below:
- When the density is zero, flow will also be zero,since there is no
vehicles on the road.
- When the number of vehicles gradually increases the density as well as
flow increases.
- When more and more vehicles are added, it reaches a situation where
vehicles can't move.
This is referred to as the jam density or the maximum density.
At jam density, flow will be zero because the vehicles are not moving.
- There will be some density between zero density and jam density, when the
flow is maximum.
The relationship is normally represented by a parabolic curve as shown in
figure 1
Figure 1:
Flow density curve
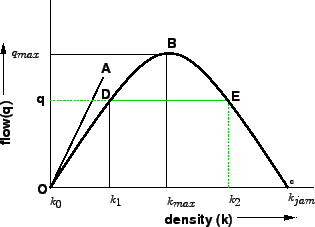 |
The point O refers to the case with zero density and zero flow.
The point B refers to the maximum flow and the corresponding density is
 .
The point C refers to the maximum density .
The point C refers to the maximum density  and the corresponding flow
is zero.
OA is the tangent drawn to the parabola at O, and the slope of the line OA
gives the mean free flow speed, ie the speed with which a vehicle can travel
when there is no flow.
It can also be noted that points D and E correspond to same flow but has two
different densities.
Further, the slope of the line OD gives the mean speed at density and the corresponding flow
is zero.
OA is the tangent drawn to the parabola at O, and the slope of the line OA
gives the mean free flow speed, ie the speed with which a vehicle can travel
when there is no flow.
It can also be noted that points D and E correspond to same flow but has two
different densities.
Further, the slope of the line OD gives the mean speed at density  and
slope of the line OE will give mean speed at density and
slope of the line OE will give mean speed at density  .
Clearly the speed at density will be higher since there are less number
of vehicles on the road. .
Clearly the speed at density will be higher since there are less number
of vehicles on the road.
|
|
| | |
|
|
|