Results and analysis:
- Most CD instruments will generate data in ellipticity (millidegrees).
- CD values of proteins and peptides are generally reported as mean residue ellipticity values [θ] in deg · cm2 · dmol -1 . This is achieved as
discussed in the subsequent steps.
- Convert the corrected spectrum into text (ASCII) file using the CD software.
- Open the text file using a computing and graphing software such as Microscoft Excel or Origin.
- Calculate the mean residue ellipticity, [θ] in deg · cm2 · dmol -1 at each wavelength using following formulae:
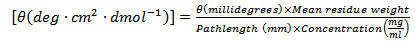 (9.4)
(9.4)

(9.5)
- Plot mean residue ellipticity [θ] as a function of wavelength [λ] to obtain the far UV CD spectrum.
Notes:
- Buffers to be used for CD spectroscopy have to be free of any optically active component. The buffer has to be as transparent in the far-UV region as possible. Water alone is the most transparent solvent but absence of salts may result in denaturation of certain proteins.
- It is necessary to determine the concentration of the protein very accurately for obtaining high quality CD data. As the response of Bradford and Lowry methods vary from protein to protein, these methods are not suitable for determining very accurate concentrations. The protein concentration should therefore be calculated either through quantitative amino acid analysis or using the published molar absorption coefficients of the proteins. In this experiment, we have used 0.1 M KCl for estimating the hen egg white lysozyme concentration as E1% for this protein is reported in 0.1 M KCl; the method for preparing the protein stock solution will differ from that discussed in this experiment.
- Instrument time constant is the measure of how quickly an instrument responds to an input. An instrument constant of 100 ms is usually sufficient for routine CD spectroscopy. The instrument response time should not be greater than the one-tenth of the data collection time at each point (1 second in this experiment).
- The PMT detectors will produce currents in response to the incoming photons. Most CD spectropolarimeters work in the constant current mode. As the wavelength decreases, the absorbance increases thereby causing lesser number of photons reaching the detector. This results in increase in the PMT voltage so as to maintain the constant current. As the PMT voltage crosses the 500 V, the spectra become noisy and less reliable. In such cases, the sample is diluted so that the absorbance of the sample decreases. If the PMT is still high, the spectra should be recorded up to relatively higher wavelengths i.e. up to ~190 or 195 nm than 185 nm.