In the limited region where ΔG is most accurately measured, it varies linearly with the concentration of denaturant (Figure 8.3).
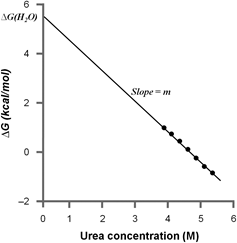
Figure 8.3: ΔG as a function of denaturant (urea) concentration. Intercept at ΔG gives the stability of the protein, ΔG (H2O). |
The equation of line is obtained from the least square analysis. ΔG in the absence of denaturant i.e.ΔG (H2O) is calculated by extrapolating the line to zero denaturant concentration. The linear equation therefore is given by:
![]()
Notes:
- As we are interested in determining the thermodynamic parameters in the unfolding reaction, it is important to ensure that the unfolding reactions have reached the equilibria before measurements are made. The equilibration time varies from protein to protein and depends on the temperature at which the reaction is being carried out; it can lie anywhere between seconds to days. Equilibrium for RNase T1, for instance, is achieved in minutes at 30 °C but takes hours at 20 °C. The solutions in the pre- and post-transitions regions equilibrate faster than those in the transition region. For an unknown protein, it is necessary to carry out a pilot study for determining the urea concentration corresponding to the transition region and the equilibration times through a pilot study.
- The optimum emission wavelength may vary from protein to protein and should be determined as discussed in the ‘Introduction' section. For RNase T1, 320 nm is the optimum wavelength.